FTX Token price lacks explosiveness, FTT doomed to fall 26%
- FTX Token price Is building an ascending broadening wedge pattern with a downside price target of $21.83.
- FTT 200-day simple moving average (SMA) rejects a rebound for the second time in July.
- Since the end of June, daily active addresses showing a gradual increase of crowd interaction with the token.

FTX Token price has failed to generate an impulsive rally off the June 20 low like other cryptocurrencies, disabling FTT from extending the new rebound beyond the 200-day SMA. It is another corrective stage in the context of a larger ascending broadening wedge pattern that began from the June 22 low. The digital token is capturing support at the 50-day SMA, but the corrective price structure points to a test of the June 26 low.
FTX Token price raises doubts about rebound continuity
In the six days leading up to yesterday’s bearish reversal from the 200-day SMA, FTX Token price had climbed 22%, putting it in line with the other two bounces in July. The lack of impulsiveness relative to other cryptocurrencies and to the notable bursts in January and February shows the lack of commitment for FTT at these levels, despite recording a 65% decline in the May-June correction. The result is the formation of an ascending broadening wedge pattern.
As a continuation pattern, the ascending broadening wedge formation projects lower FTT prices moving forward. The conservative measured move for the formation is $21.83, the wedge’s lowest point, representing a 26% drop from the current FTX Token price. The more aggressive target price is based on the overall height of the formation, which is 53%. A 53% decline from the wedge’s lower trend line targets a low of $11.50.
An FTX Token price decline to $11.50 would overwhelm the support attributed to the 50-week SMA at $21.01 and the 78.6% Fibonacci retracement of the advance beginning in July 2019 at $14.32.
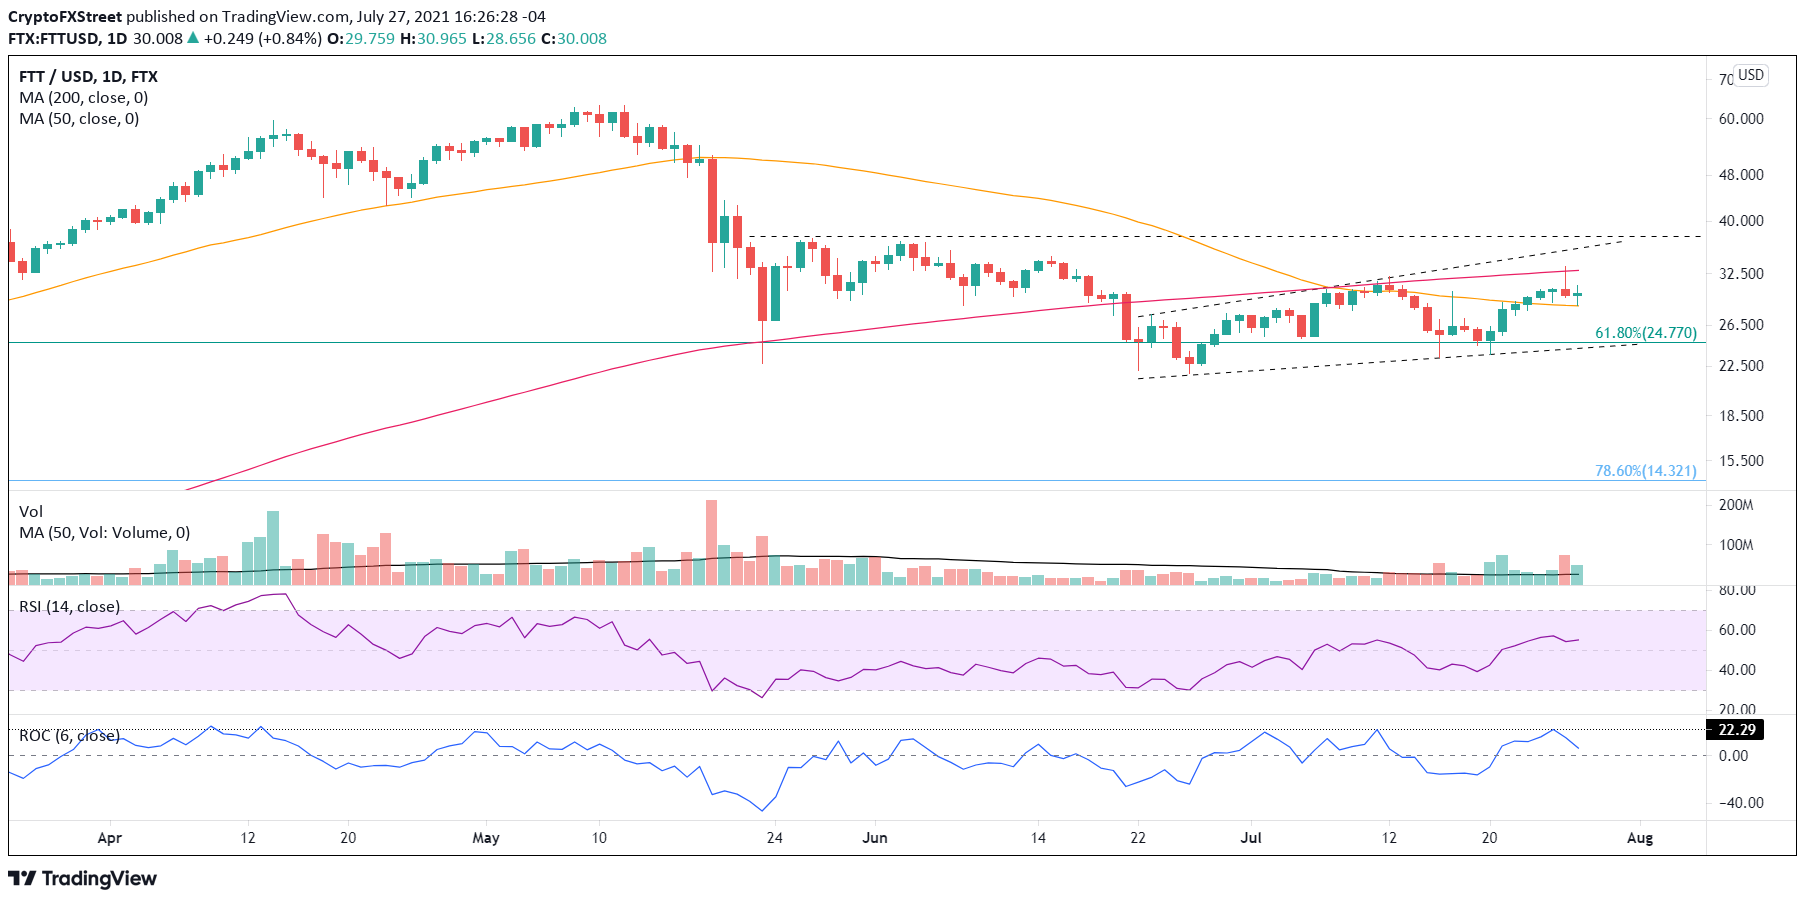
FTT/USD daily chart
To void the bearish narrative outlined by the wedge pattern, FTX Token price needs a daily close above the wedge’s topside trend line, currently at $35.70. The second point of confirmation is the May 27 high of $37.38. A measured move of 53% from the topside trend line would yield a price target of $54.62, putting FTT near the May all-time high of $63.21.
One on-chain metric supporting an upward resolution of the ascending broadening wedge pattern is the Daily Active Addresses, as shown with the 30-day SMA. Since the June low, there has been an increase in the number of unique addresses involved in FTT transactions on a daily basis. It indicates that there could be some accumulation occurring at the current FTX Token price levels.
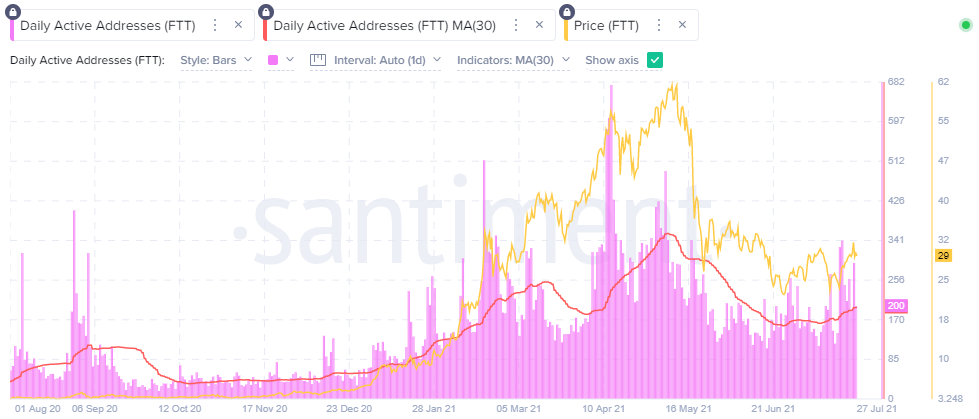
FTT Daily Active Addresses - Santiment
As of today, based on the FTX Token price action over the last month, the price outlook is bearish, with at least a 26% loss on the horizon. Without the explosiveness that defines firm correction lows, FTT is doomed for bearish outcomes unless there is a significant revival of commitment and emotion in the digital asset.
Author

Sheldon McIntyre, CMT
Independent Analyst
Sheldon has 24 years of investment experience holding various positions in companies based in the United States and Chile. His core competencies include BRIC and G-10 equity markets, swing and position trading and technical analysis.


