Fantom Price Prediction: A 70% rally awaits as FTM nearly confirms this historical pattern
- Fantom price on the weekly chart is close to a bullish breakout, trading at $0.558
- The altcoin is forming a double bottom pattern, also known as a W pattern, which suggests long-term bullishness.
- Flipping the $0.568 resistance level into support would place the immediate target for FTM at $0.965, marking a 70% rally.

Fantom price is on the path of bringing considerable profits to its investors, who have been stuck witnessing consolidation since May 2022. The pattern being formed by the present price action is known for being a bullish pattern, and a successful breakout would result in the price hitting a 21-month high.
Fantom price at the cusp of a bull run
Fantom price trading at $0.558 at the time of writing, has rallied by nearly 200% in Q4 and is presently standing below the resistance level of $0.568. This barrier has remained unbreached since Fantom crashed over 84% in May 2022, and flipping this price level into a support floor would signal a bullish breakout.
This is because it would satisfy the conditions necessary for confirming a double bottom pattern, also known as the ‘W’ pattern. This pattern is formed when an asset hits two distinct lows at the same level on separate trading sessions.
The level to which the price falls twice is considered the support level. In the case of FTM, this support level is marked at $0.171, which the altcoin has bounced back from at the beginning of November 2022 and again in the first week of October this year.
When inferring this pattern, the target is calculated by looking at the height of the double bottom pattern. A similar increase above the breakout level, also known as neckline, is the projected growth. The neckline for FTM is marked at $0.568, and the height of the pattern places the target at $0.965.
If FTM manages to satisfy this outcome, it would present a 70% increase in price from the current trading price. This rally would also set the altcoin up for a potential rise to $1.639, erasing the 84% crash from May 2022.
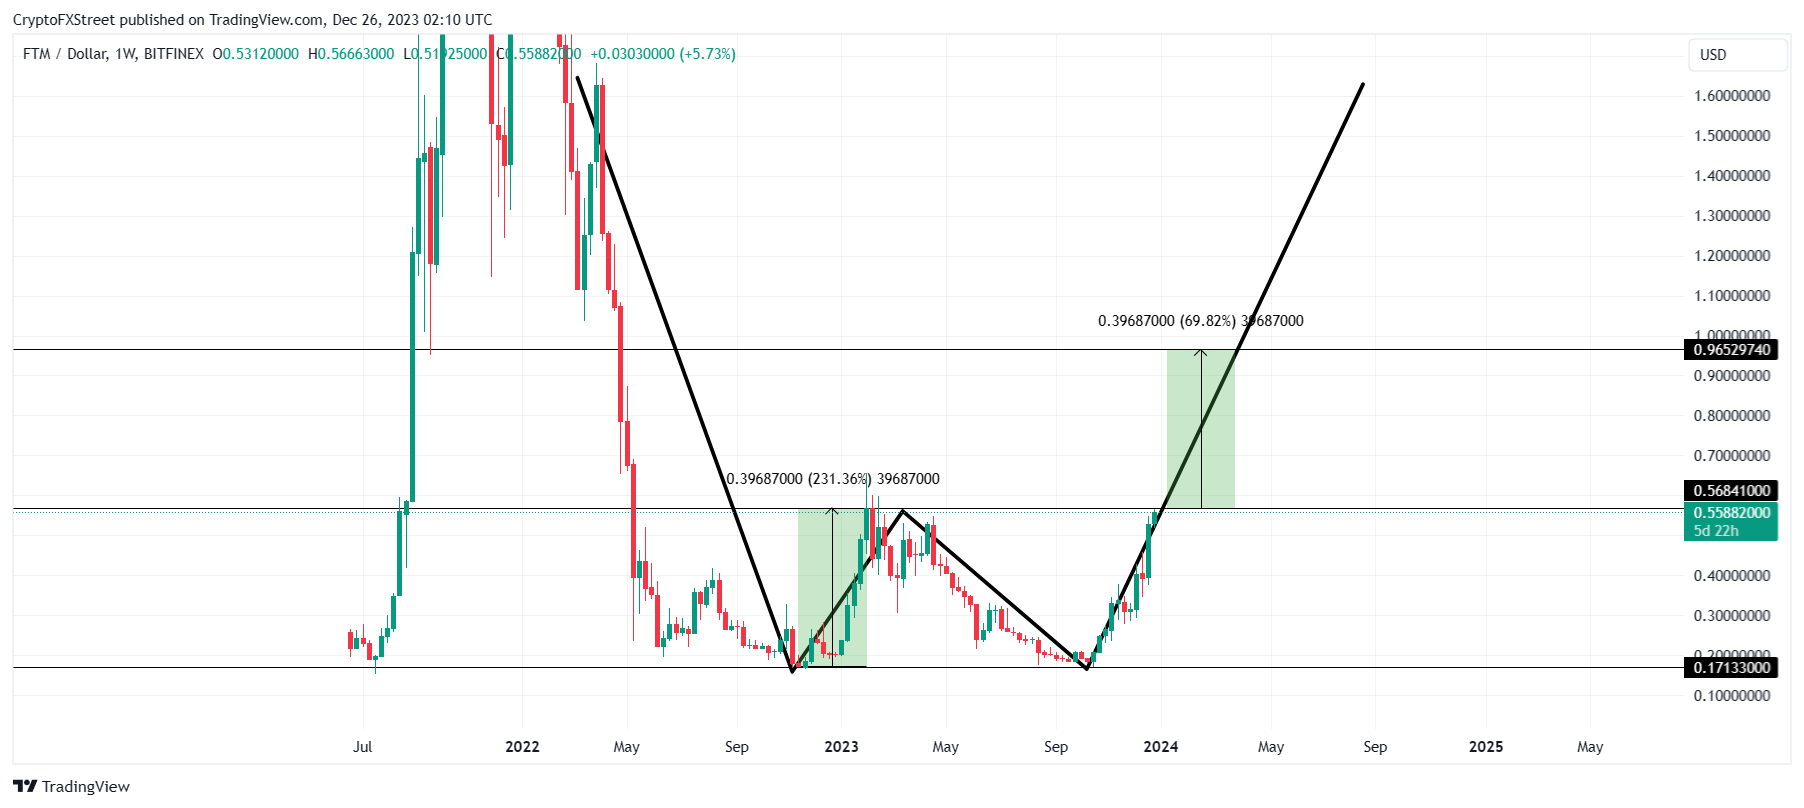
FTM/USD 1-week chart
However, in the case that unexpected bearish events or broader market cues pull Fantom price down, the neckline would act as the support level. Falling through this line would essentially mean that the pattern has failed. It would be wise for investors to place a stop loss at $0.450 in such a case.
Author

Aaryamann Shrivastava
FXStreet
Aaryamann Shrivastava is a Cryptocurrency journalist and market analyst with over 1,000 articles under his name. Graduated with an Honours in Journalism, he has been part of the crypto industry for more than a year now.


