Fantom price poised for a rally as on-chain data shows bullish bias
- Fantom price is nearing its key resistance level at $0.746; a firm close above it could continue the rally.
- On-chain data paints a bullish picture, as FTM’s Exchange Flow Balance shows a negative spike and fees collected are the highest since November 2023.
- A daily candlestick close below $0.642 would invalidate the bullish thesis.

Fantom (FTM) price extends its gains on Tuesday, approaching a crucial resistance level; a firm close above it could continue the rally. On-chain data further supports the rally, as FTM’s Exchange Flow Balance shows a negative spike and high fee collection, indicating a rally on the horizon.
Fantom price shows potential for a rally
Fantom's price broke above its 200-day Exponential Moving Average (EMA) at $0.558 on September 17 and rallied over 24% in the next four days. After this rally, FTM was rejected from the 50% price retracement level (drawn from the March high of $1.22 to the August low of $0.264) multiple times, around $0.746. At the time of writing on Tuesday, it is approaching the $0.746 level.
If FTM breaks and closes above $0.746, it could rally over 15% to retest its June 5 high of $0.855.
The Moving Average Convergence Divergence (MACD) indicator is about to show a bullish crossover on the daily chart. If the MACD line (blue line) moves above the signal line (yellow line), it would give a buy signal. This suggests bulls are in control, and the Fantom price could experience upward momentum.
Additionally, the Relative Strength Index (RSI) on the daily chart trades at 61, above its neutral level of 50 and still far from the overbought condition, suggesting bullish momentum and a further rise ahead in Fantom.
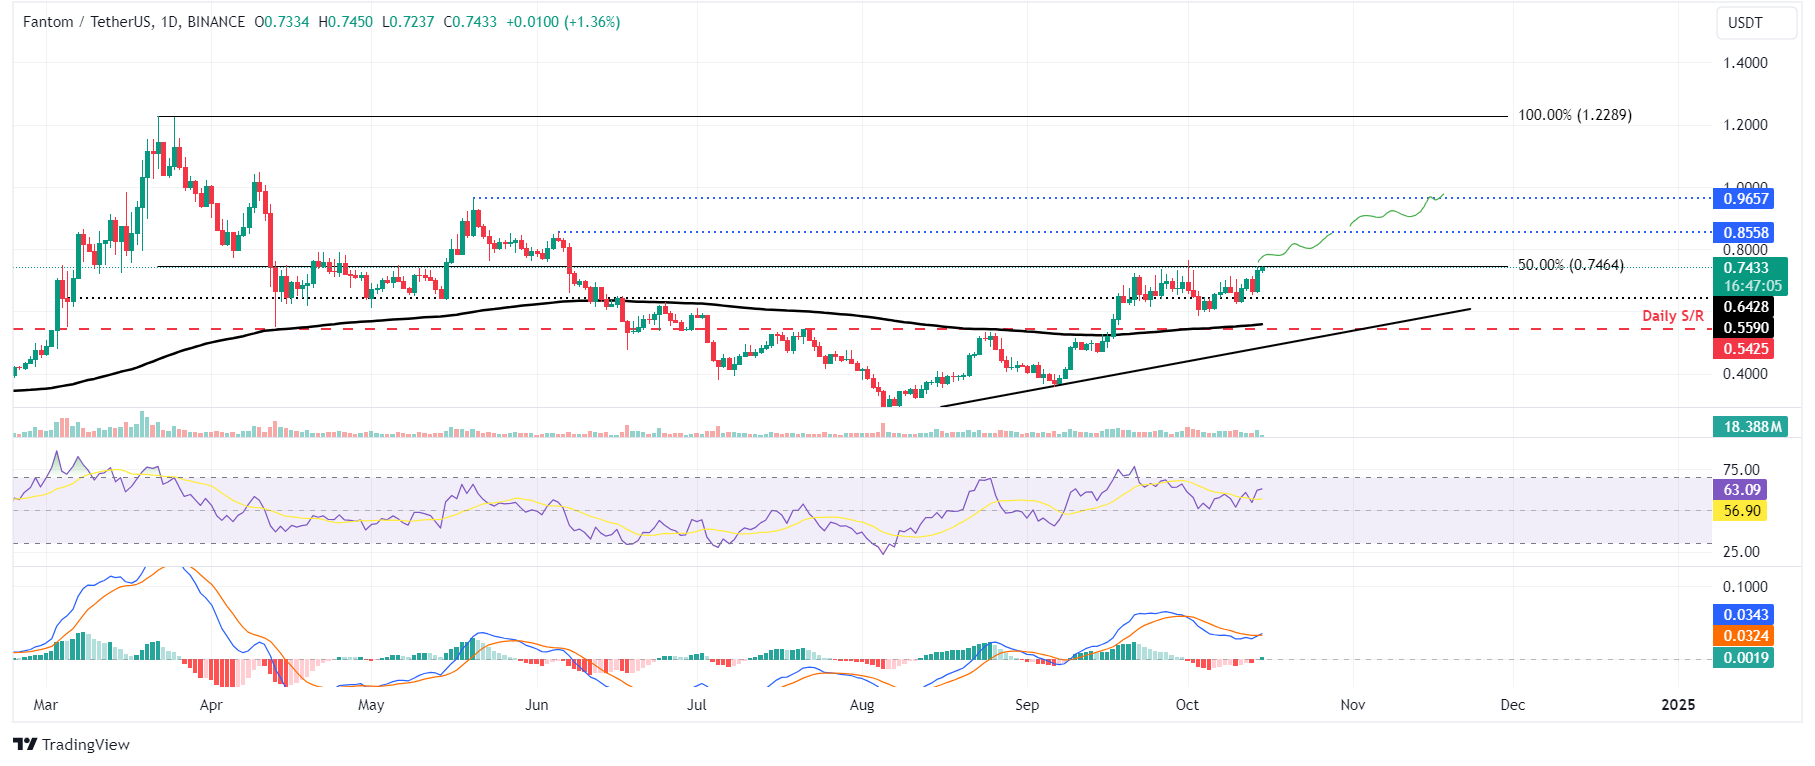
FTM/USDT daily chart
Fantom’s on-chain metrics further support its bullish outlook. Santiment’s Exchange Flow Balance metric shows the net movement of FTM tokens into and out of exchange wallets.
A rise in this metric indicates more FTM has entered the exchanges than exited, hinting at selling pressure from investors. Conversely, a fall in the metric indicates that more FTM tokens left the exchange than entered, storing them in cold wallets and indicating less selling pressure from investors.
In the case of Fantom, this metric slumped from -673,150 to -3.66 million from Sunday to Monday. This fall in Exchange Flow Balance indicates increasing confidence among investors as holders remove FTM tokens from exchanges and store them in cold wallets, leading to a 3.32% decrease in supply on exchanges.
%20[11.28.16,%2015%20Oct,%202024]-638645766718272328.png)
FTM Exchange Flow Balance and Supply on Exchange chart. Source: Santiment
Moreover, token terminal data for fee collection also aligns with Fatom’s bullish outlook.
The data shows that Fantom collected fees of $100,829 on Sunday, the highest level since November 2023. This high fee collection indicates that the demand for FTM’s platform usage is increasing, which could propel a rally in Fantom's price.
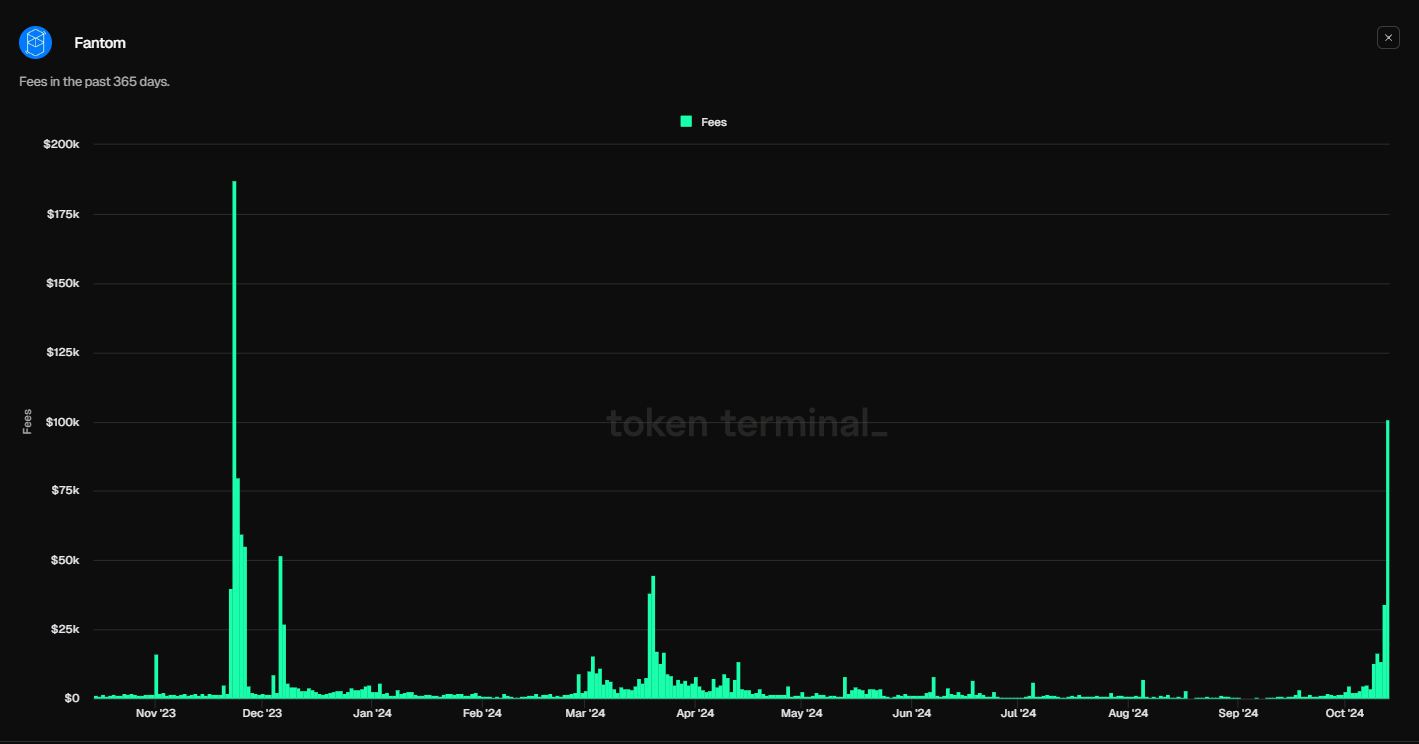
Fanton Fees in the past 365 days chart. Source: Token terminal
However, if Fantom's price declines and closes below the $0.642 daily support, the bullish thesis would be invalidated. This scenario could extend the decline by 13% to retest its 200-day EMA at $0.558.
Author

Manish Chhetri
FXStreet
Manish Chhetri is a crypto specialist with over four years of experience in the cryptocurrency industry.


