Fantom looks set for double-digit gains following retest of key support level
- Fantom extends gains on Tuesday after finding support at a key support level last week.
- FTM’s long-to-short ratio jumps to the highest level in October, indicating more traders are anticipating a rally.
- A daily candlestick close below $0.577 would invalidate the bullish thesis.

Fantom (FTM) extends its gains for a fourth consecutive day on Tuesday after finding support at around $0.577 on Friday. The token’s technical outlook suggests double-digit gains are on the horizon, bolstered by a rising long-to-short ratio that reached its highest level in October.
Fantom price outlook improves after four-day rally
Fantom price retested and found support around its 200-day Exponential Moving Average (EMA) around $0.577 on Friday and rallied over 11% in the next three days. The 200-day EMA level roughly coincided with the 50% price retracement at $0.613, making this level a key reversal zone. At the time of writing on Tuesday, it continues to trade higher around $0.707.
If the $0.577 level continues to hold as support, FTM could rally another 12% from its current trading level to retest the daily resistance level at $0.796. A successful close above $0.796 could mean an additional rally of 22% to retest its May 20 high of $0.965.
The Relative Strength Index (RSI) on the daily chart reads at 54, flipping over its neutral level of 50, indicating that bullish momentum is gradually gaining traction.
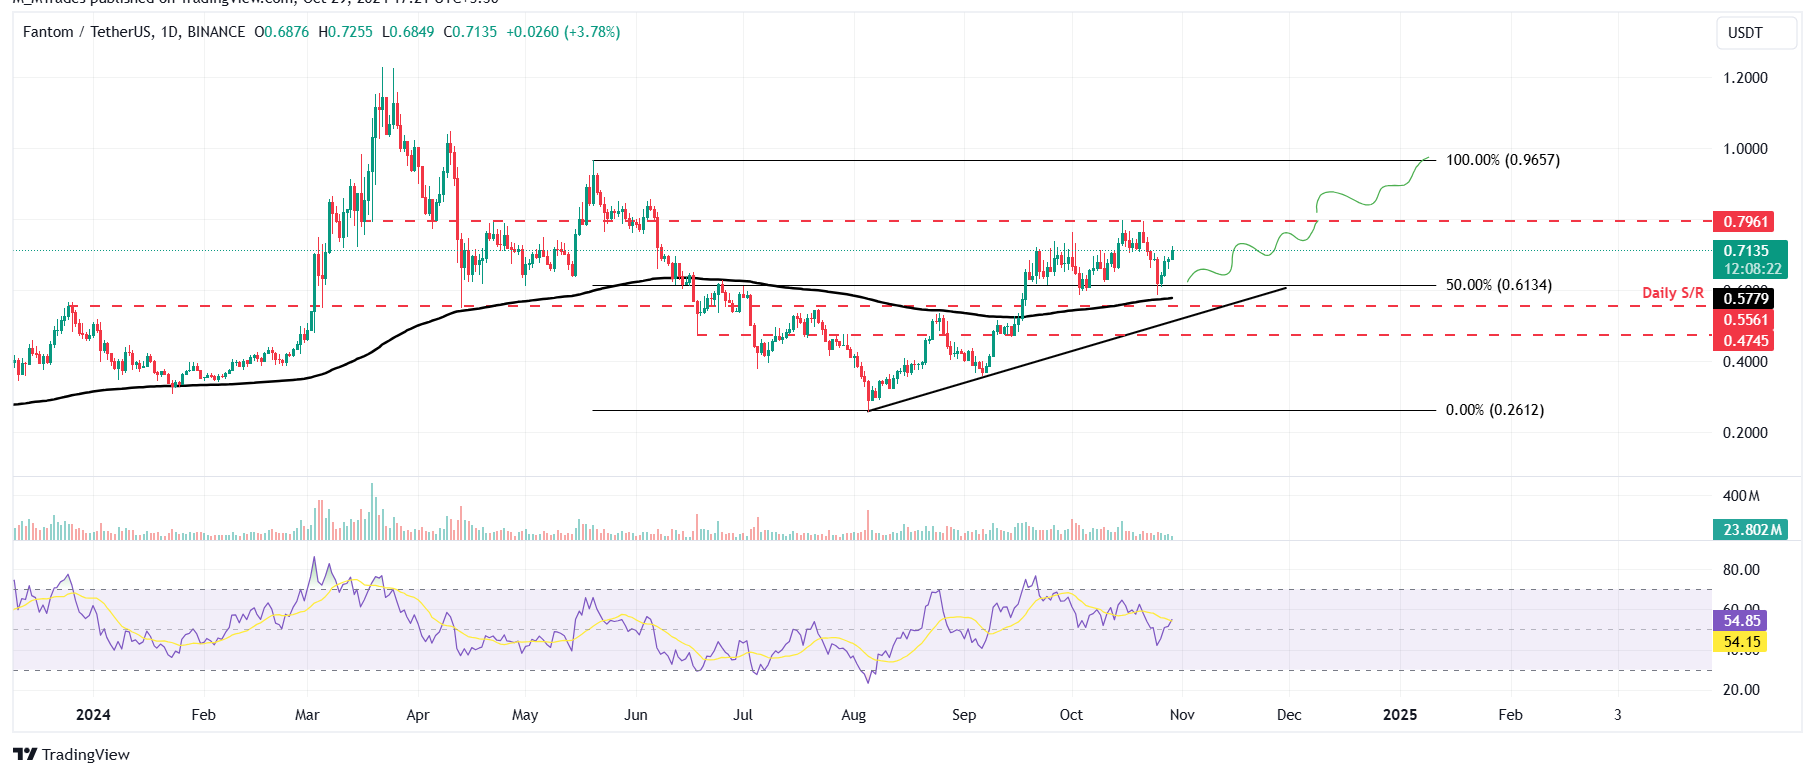
FTM/USDT daily chart
Based on IntoTheBlock’s Global In/Out of the Money (GIOM), nearly 4,320 addresses accumulated 678.91 million FTM tokens at an average price of $0.588. These addresses bought the tokens between $0.529 and $0.650, which makes it a key support zone.
Interestingly, the $0.577 level mentioned from a technical analysis perspective – the 200-day EMA – roughly coincides with the GIOM findings, making this zone a key reversal area to watch.
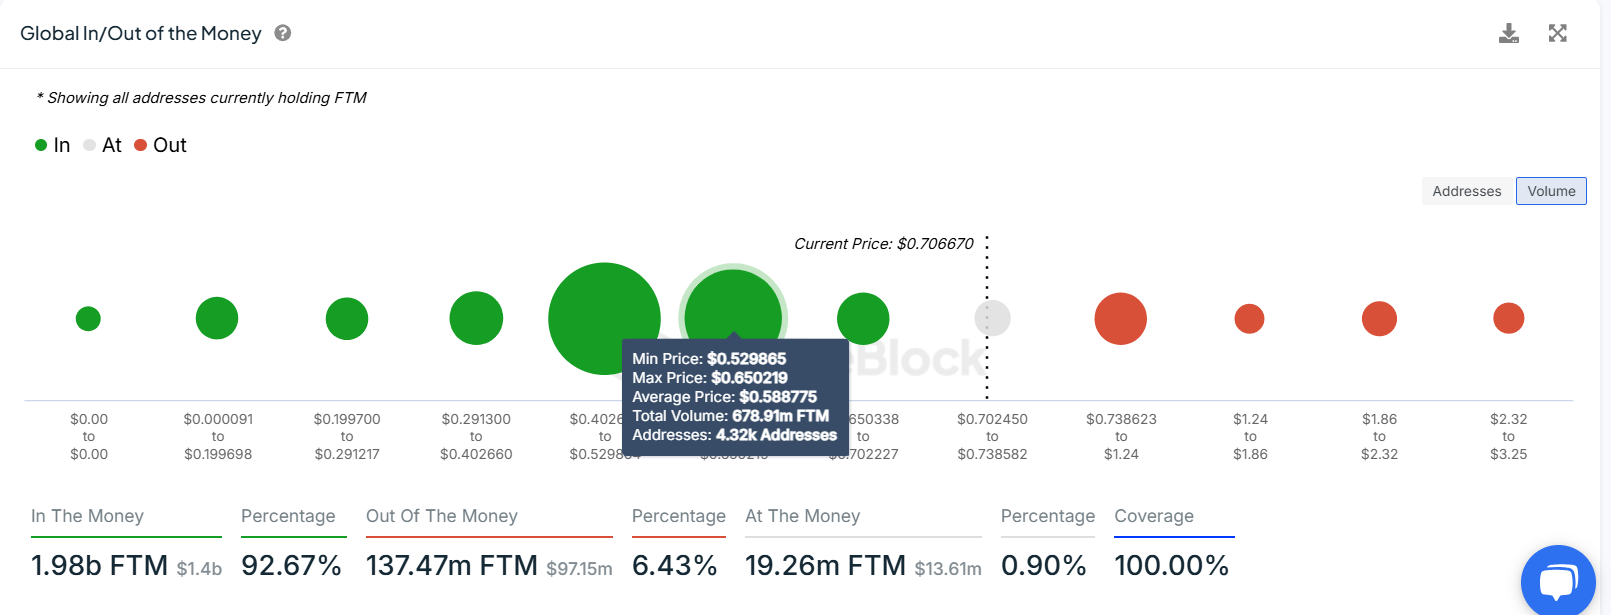
FTM GIOM chart. Source: IntoTheBlock
According to Coinglass’s data, FTM’s long-to-short ratio stands at 1.06, the highest level in a month. This ratio reflects bullish sentiment in the market, as the number above one suggests that more traders anticipate the price of Fantom to rise.
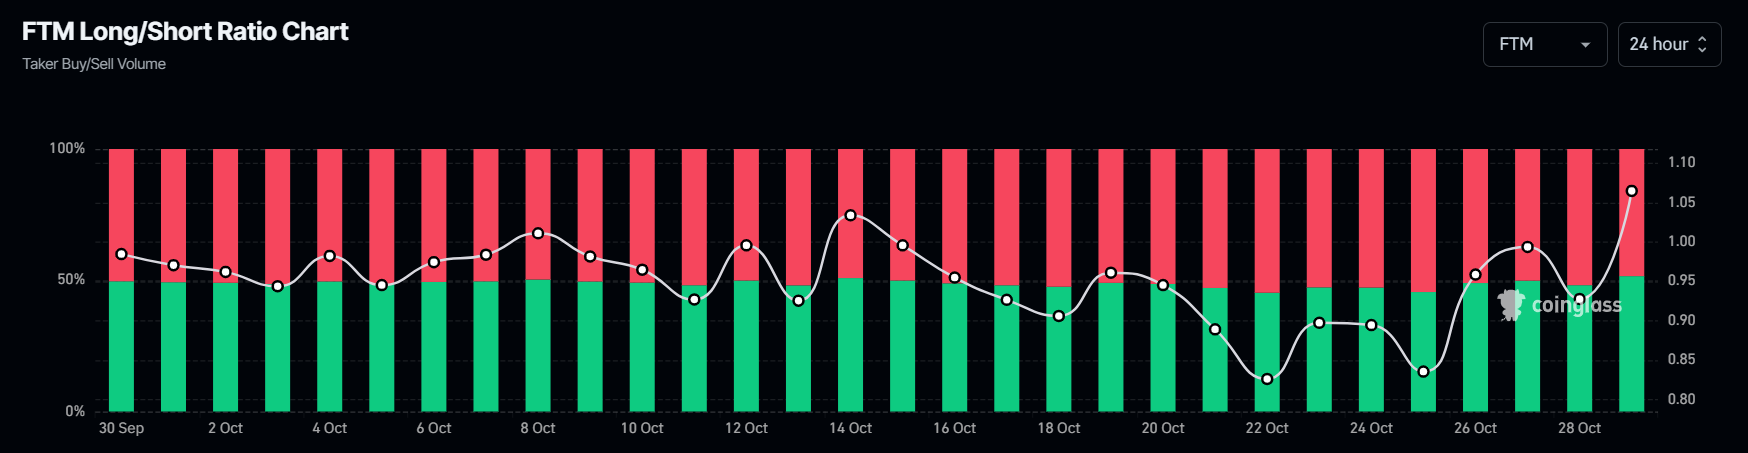
FTM long-to-short chart. Source: Coinglass
If FTM fails to find support at the $0.577 level and closes below it, the bullish thesis will be invalidated. This scenario could lead to a fall in Fantom’s price to retest its next daily support level at $0.474.
Author

Manish Chhetri
FXStreet
Manish Chhetri is a crypto specialist with over four years of experience in the cryptocurrency industry.


