|

Ethereum technical analysis: Bulls take control of ETH/USD and try to break into the $190-zone

  • The MACD indicator on the daily ETH/USD chart shows sustained bullish momentum.
  • The four-hour chart is floating above the green Ichimoku cloud.

ETH/USD daily chart

fxsoriginal

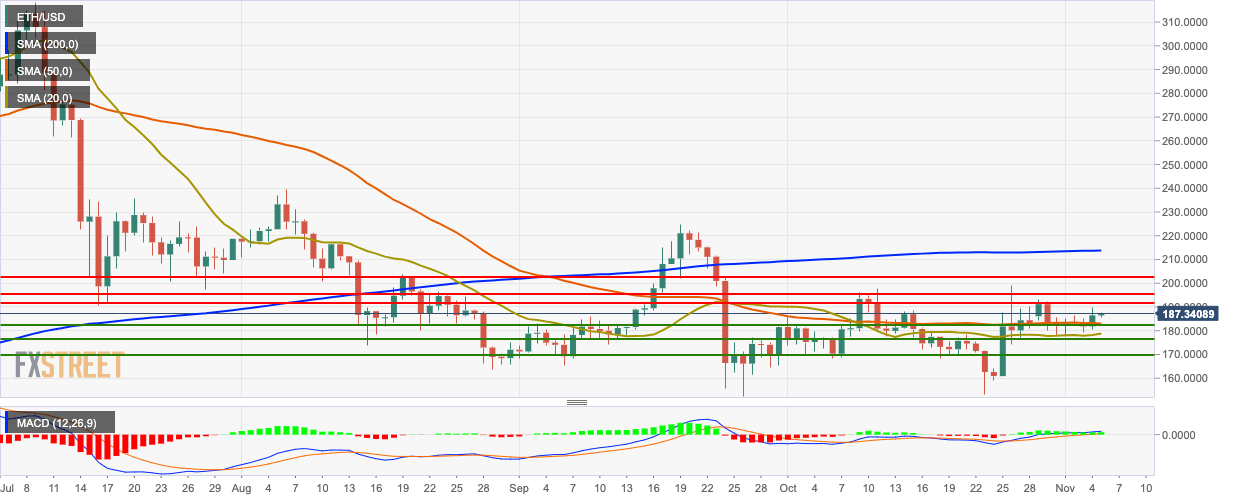
ETH/USD went up from $186.45 to $187.65 so far this Tuesday. The price is trending above the 20-day Simple Moving Average (SMA 20) and SMA 50 curves, with the latter acting as immediate support. The Moving Average Convergence/Divergence (MACD) indicates sustained bullish momentum.

ETH/USD four-hour chart

fxsoriginal

The four-hour chart is floating above the green Ichimoku cloud and the SMA 20 curve has crossed over with the SMA 50. The price is consolidating in a flag formation before a potential breakout. The Elliott Oscillator has had six straight green sessions of increasing intensity.

ETH/USD hourly chart

fxsoriginal

The hourly chart is trending above the SMA 20, SMA 50 and SMA 200 curves. The 20-day Bollinger jaw has narrowed, indicating decreasing price volatility. The Relative Strength Index (RSI) indicator is floating right next to the overbought zone, hinting that a short-term bearish correction may be around the corner.

Key Levels

ETH/USD

Overview
Today last price187.69
Today Daily Change1.24
Today Daily Change %0.67
Today daily open186.45
 
Trends
Daily SMA20178.19
Daily SMA50183.58
Daily SMA100189.85
Daily SMA200213.51
 
Levels
Previous Daily High189.68
Previous Daily Low180.66
Previous Weekly High193.29
Previous Weekly Low177.01
Previous Monthly High199.04
Previous Monthly Low153.28
Daily Fibonacci 38.2%186.24
Daily Fibonacci 61.8%184.11
Daily Pivot Point S1181.51
Daily Pivot Point S2176.57
Daily Pivot Point S3172.49
Daily Pivot Point R1190.54
Daily Pivot Point R2194.62
Daily Pivot Point R3199.56


Author

Rajarshi Mitra

Rajarshi Mitra

Independent Analyst

Rajarshi entered the blockchain space in 2016. He is a blockchain researcher who has worked for Blockgeeks and has done research work for several ICOs. He gets regularly invited to give talks on the blockchain technology and cryptocurrencies.

More from Rajarshi Mitra
Share:

Editor's Picks

Solana strikes key resistance with double-digit gains

Solana trades at $88 at press time on Thursday, after an 11% upswing the previous day within a broader consolidation range of roughly three weeks. Institutional demand for Solana heightens as US spot SOL Exchange Traded Funds record $30 million of inflow on Wednesday.

Stellar relief bounce fades as bearish undertone persists

Cardano price steadies at $0.29 on Thursday after surging over 14% in the previous day. Improving on-chain and derivatives data support a positive outlook as whale wallets are increasing exposure alongside positive funding rates.

Top Crypto Gainers: Polkadot, Near Protocol, Uniswap lead market rebound

Altcoins, such as Polkadot, Near Protoco, and Uniswap, are leading gains over the last 24 hours as Bitcoin jumped 6% on Wednesday. The altcoins are holding steady on Thursday following a rebound the previous day, testing the waters around their 50-day EMA. 

Cardano steadies as whales accumulate and bullish sentiment grows

Cardano price steadies at $0.29 on Thursday after surging over 14% in the previous day. Improving on-chain and derivatives data support a positive outlook as whale wallets are increasing exposure alongside positive funding rates.

Bitcoin Price Annual Forecast: BTC holds long-term bullish structure heading into 2026

Bitcoin (BTC) is wrapping up 2025 as one of its most eventful years, defined by unprecedented institutional participation, major regulatory developments, and extreme price volatility.

Bitcoin: No recovery in sight

Bitcoin (BTC) price continues to trade within a range-bound zone, hovering around $67,000 at the time of writing on Friday, and falling slightly so far this week, with no signs of recovery.