Ethereum Price Prediction: Network activity signals red days ahead
- Ethereum price shows a significant influx of investors actively participating in the network.
- The bears have successfully breached the 8-day exponential moving average.
- Invalidation of the bearish thesis is a breach above $1,330.

Ethereum price could become problematic for long-term investors as a sweep-the-lows event is becoming more self-fulfilling. Key levels have been identified.
Ethereum price is setting up for a correction
Ethereum price displays concerning on-chain metrics that investors should be aware of. According to Santiment’s 30-Day Active Addresses Indicator, more than 750,000 addresses have become active in October. Statistically, whenever the indicator begins ramping higher, a sharp correction in price occurs shortly after.
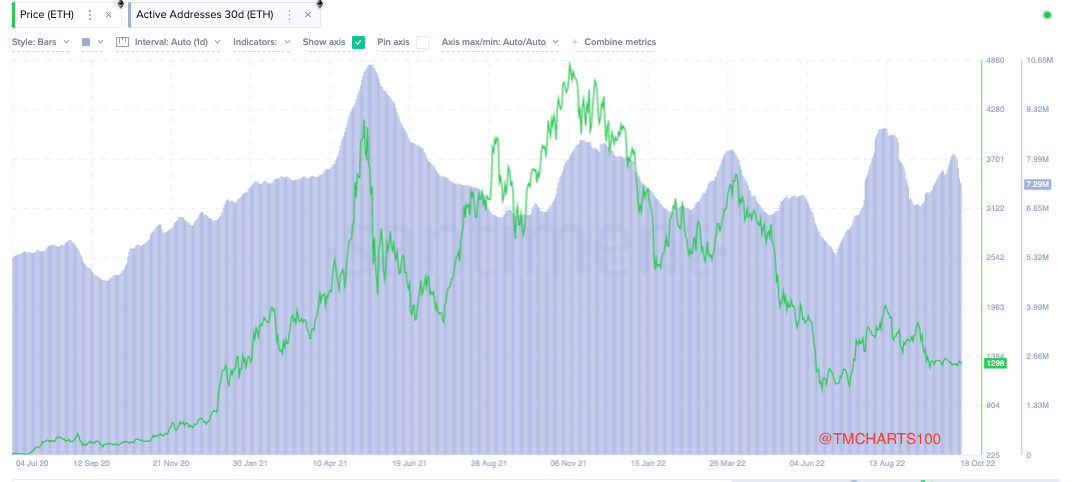
Santiment’s 30-Day Active Addresses Indicator
Ethereum price currently auctions at $1,299. The bears have successfully breached the 8-day exponential moving average (EMA). The Relative Strength Index also forged the last rejection in ideal territory for a powerful downtrend. If market conditions are genuinely bearish the Ethereum price will continue stair-stepping south towards $1,220 and lower.
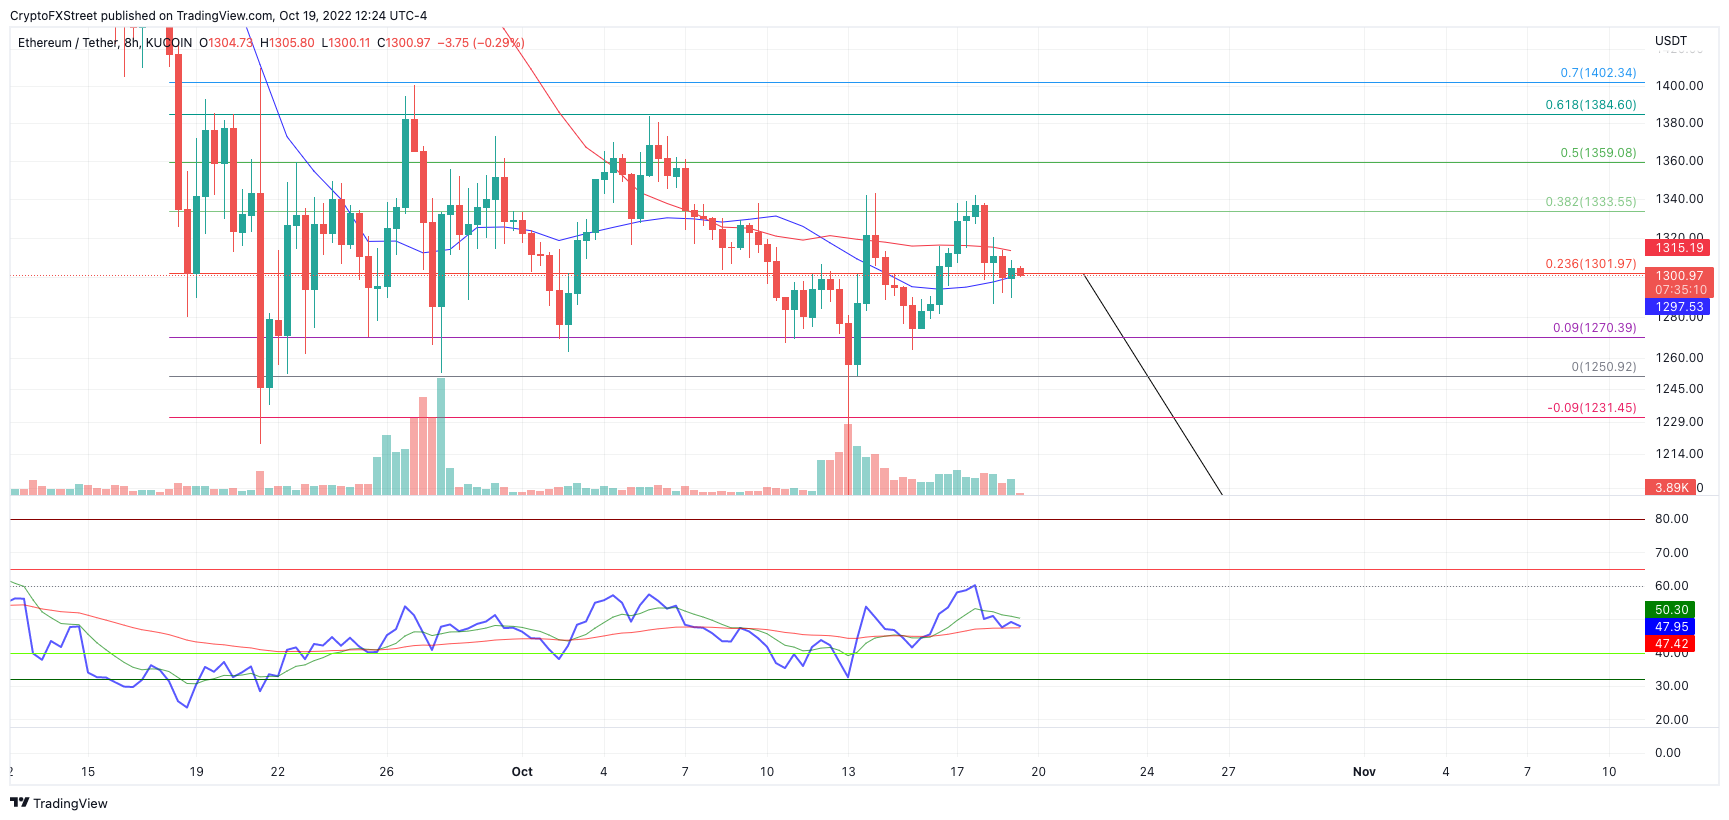
ETH/USDT 8-Hour Chart
The bulls will need to break above both the 8-day EMA and 21-day Simple Moving Average (SMA) at $1,330 to create an alternative bullish scenario. If the hurdles are breached, a reasonable bullish scenario would be a retest of the October high near $1,380 Such a move would result in a 7% increase from the current Ethereum price.
In the following video, our analysts deep dive into the price action of Ethereum, analyzing key levels of interest in the market. -FXStreet Team
Author

Tony M.
FXStreet Contributor
Tony Montpeirous began investing in cryptocurrencies in 2017. His trading style incorporates Elliot Wave, Auction Market Theory, Fibonacci and price action as the cornerstone of his technical analysis.


