Ethereum Price Forecast: ETH demand must increase to fuel any rally

Ethereum price today: $2,600
- Ethereum price broadly consolidates but the upside bias persists after breaking above its 50-day EMA at $2,544.
- US spot Ethereum ETFs records a net inflow of $79.9 million this week until Thursday.
- Ethereum co-founder Vitalik Buterin said he wants the platform to process 100,000 transactions per second.
Ethereum (ETH) edges up slightly on Friday, adding to 6.5% gains so far this week after surpassing key resistance levels on Monday, bolstered by a net positive inflow of over $79 million through Thursday. Despite this influx, CryptoQuant’s Ethereum Coinbase Premium Index remains below neutral levels, indicating that demand must rise to sustain the anticipated rally.
Ethereum aims for 100,000 TPS, says Vitalik Buterin
Ethereum co-founder Vitalik Buterin said in a blog post published on Thursday that he wants the platform to process 100,000 transactions per second (tps).
Ethereum’s rollup-centric roadmap, which combines Layer 2 scaling solutions, advanced data availability sampling, and data compression techniques, will achieve this 100,000 TPS goal, he said.
"If we are serious about the idea that L2s are part of Ethereum, we need to make using the L2 ecosystem feel like using a unified Ethereum ecosystem," he added.
Ethereum demand needs to climb higher
Institutional flows supported Ethereum’s price this week. According to Coinglass data, US spot Ethereum ETFs experienced three days of inflow and one day of mild outflows until Thursday, totaling $79.9 million in net inflows. Studying the ETF flow data can be useful for observing institutional investors’ sentiment toward Ethereum. Still, the magnitude of these inflows should increase in order to have a significant impact on the altcoin’s price.
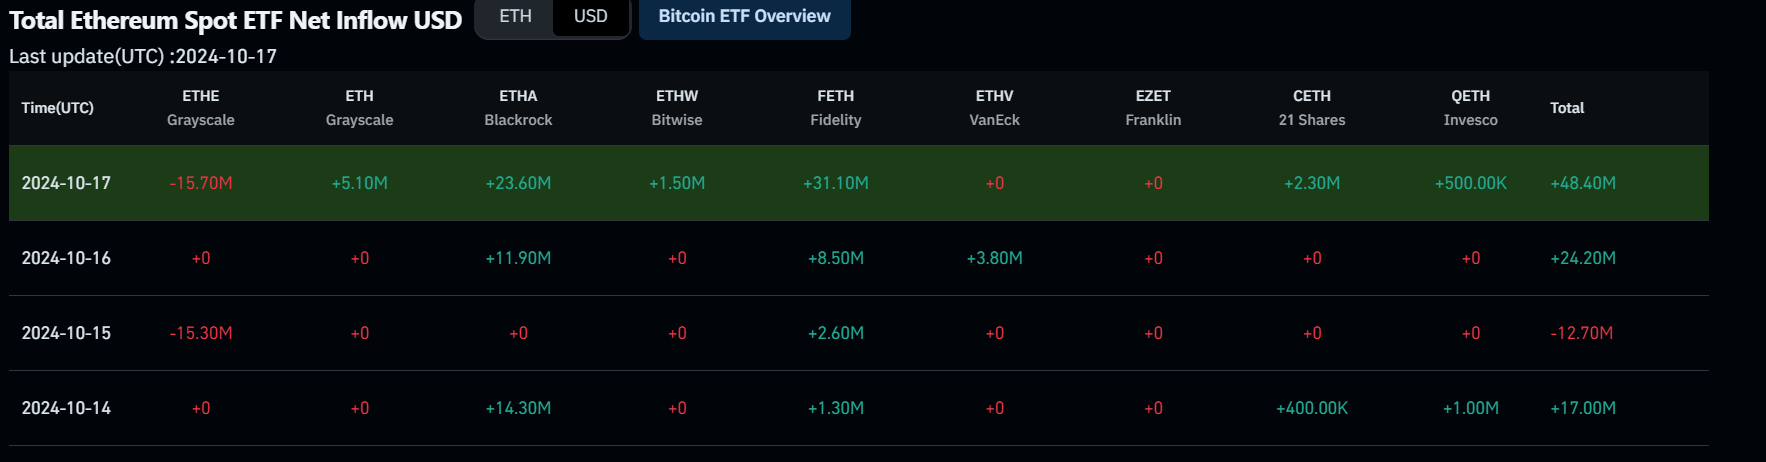
Total Ethereum Spot ETF Net Inflow chart. Source: Coinglass
Despite the net positive inflow, CryptoQuant’s Ethereum Coinbase Premium Index remains below its neutral levels. This indicator measures the price gap between Coinbase Pro (USD pair) and Binance (USDT pair) and serves as a key metric for assessing the behavior of large-wallet investors as it reflects whale accumulation trends. This is significant because Coinbase Pro is a primary gateway for institutional cryptocurrency purchases.
In the case of Ethereum, the metric currently stands at -0.034, below its neutral level of zero. For Ethereum’s price to rally, the metric must rise above its neutral value of zero.
-638648435238379052.png)
Ethereum: Coinbase Premium Index chart. Source: CryptoQuant
Since the beginning of the bull market around the end of 2023, Ethereum has lagged behind other cryptos, partly due to a significant drop in demand and the subdued launch of the US-listed spot ETH ETFs.
Despite a 28.57% rise in Open Interest (OI) to $9.6 billion from August to October, market sentiment towards ETH remains cautious as OI is still well below June’s $13 billion.
However, the current Relative Strength Index (RSI) of 61, coupled with the convergence of higher lows in the RSI, suggests that any forthcoming corrections could be mild, favoring long positions as traders await a rebound to confirm new highs and higher lows.
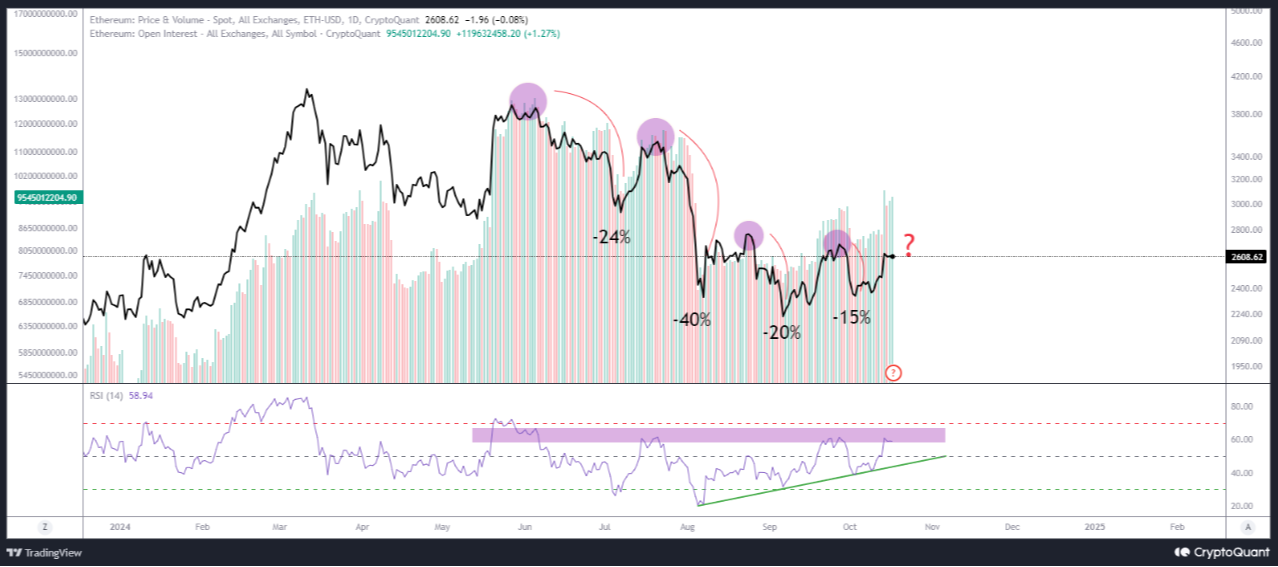
Ethereum Open Interest and RSI chart. Source: CryptoQuant
Ethereum Price Forecast: Will ETH reach $2,800?
Ethereum price broke above the daily resistance level at $2,461 and rallied 6.5%, closing well above its 50-day Exponential Moving Average (EMA) at $2,544 on Monday. After such a rally, ETH declined to test the 50-day EMA at $2,544 and bounced off on Tuesday. At the time of writing on Friday, it is trading slightly up at around $2,600.
If the 50-day EMA at $2,544 holds as support, ETH could extend the rally to retest its August 24 high of $2,820.
The Relative Strength Index (RSI) indicator on the daily chart hovers around 60, above its neutral level of 50, suggesting bullish momentum is gaining traction.
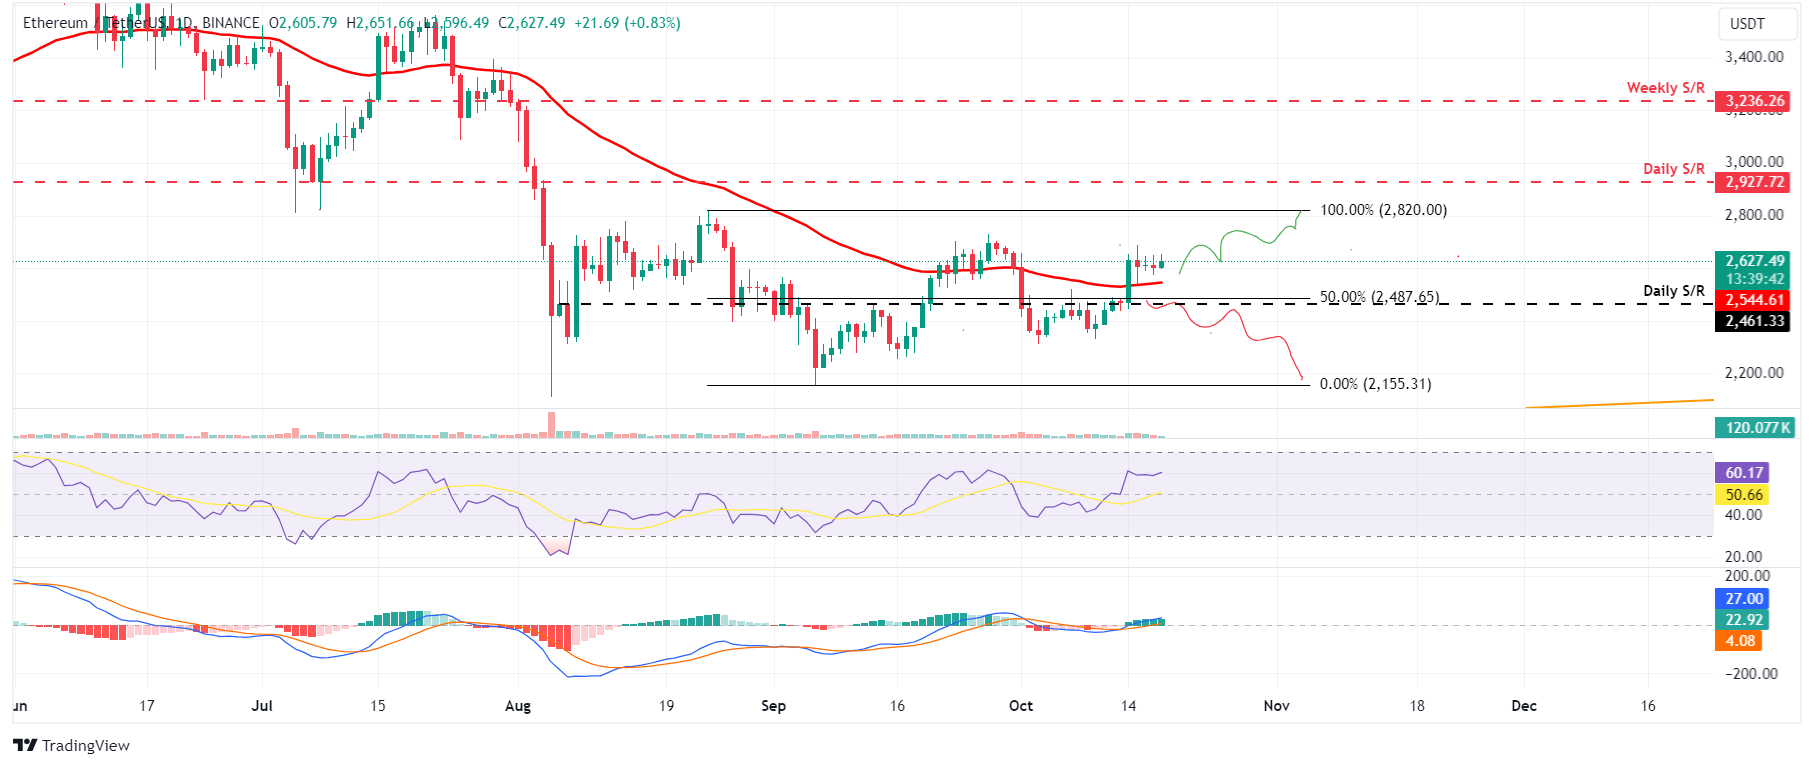
ETH/USDT daily chart
However, if Ethereum’s price closes below the daily support level at $2,461, it could extend the decline by 13% to retest its September 6 low of $2,150.
Ethereum FAQs
Ethereum is a decentralized open-source blockchain with smart contracts functionality. Its native currency Ether (ETH), is the second-largest cryptocurrency and number one altcoin by market capitalization. The Ethereum network is tailored for building crypto solutions like decentralized finance (DeFi), GameFi, non-fungible tokens (NFTs), decentralized autonomous organizations (DAOs), etc.
Ethereum is a public decentralized blockchain technology, where developers can build and deploy applications that function without the need for a central authority. To make this easier, the network leverages the Solidity programming language and Ethereum virtual machine which helps developers create and launch applications with smart contract functionality.
Smart contracts are publicly verifiable codes that automates agreements between two or more parties. Basically, these codes self-execute encoded actions when predetermined conditions are met.
Staking is a process of earning yield on your idle crypto assets by locking them in a crypto protocol for a specified duration as a means of contributing to its security. Ethereum transitioned from a Proof-of-Work (PoW) to a Proof-of-Stake (PoS) consensus mechanism on September 15, 2022, in an event christened “The Merge.” The Merge was a key part of Ethereum's roadmap to achieve high-level scalability, decentralization and security while remaining sustainable. Unlike PoW, which requires the use of expensive hardware, PoS reduces the barrier of entry for validators by leveraging the use of crypto tokens as the core foundation of its consensus process.
Gas is the unit for measuring transaction fees that users pay for conducting transactions on Ethereum. During periods of network congestion, gas can be extremely high, causing validators to prioritize transactions based on their fees.
Author

Manish Chhetri
FXStreet
Manish Chhetri is a crypto specialist with over four years of experience in the cryptocurrency industry.


