Ethereum price analysis: ETH/USD bullish flag structure subject to a breakout
- Ethereum late on Thursday is trading in the red by some 3%, as the price continues to cool.
- ETH/USD price action despite the loss in the session is moving within a bullish flag structure.

The Ethereum price is nursing losses of around 3% in the latter part of trading on Thursday. ETH/USD has been within consolidation mode over the past 3 weeks, after the strong surge north in the early part of the month.
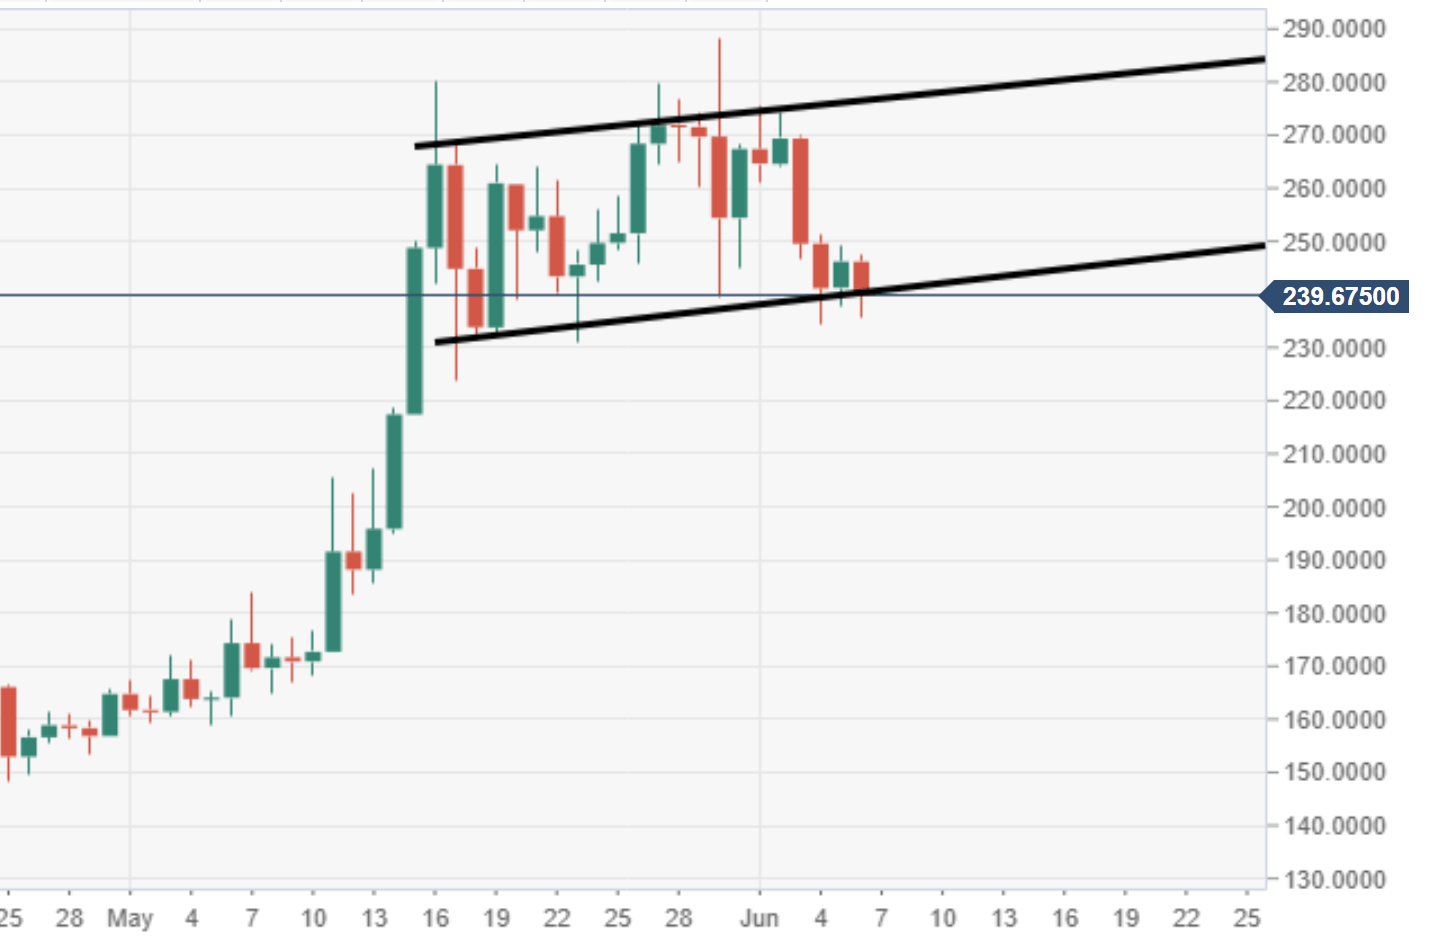
ETH/USD price action has formed a bullish flag pattern structure, subject to further potential moves north. Since the aggressive move higher in May, price action has somewhat cooled, as the bulls take a breather ahead of a continued committed move.
In terms of technical, there is immediate resistance seen just above, the upper acting trend line of a bullish flag pattern. The area of problem for the bulls is seen at $275, should a breach be seen, a strong wave of buying pressure may follow.
ETH/USD daily chart
Author

Ken Chigbo
Independent Analyst
Ken has over 8 years exposure to the financial markets. He started his career as an analyst, covering a variety of asset classes; forex, fixed income, commodities and equities.


