Ethereum Price Analysis: ETH/USD bears take charge this Monday following four straight bullish days
- Elliott Oscillator has had 10 green sessions out of the last 11.
- The MACD indicator shows increasing bullish momentum.

ETH/USD daily chart
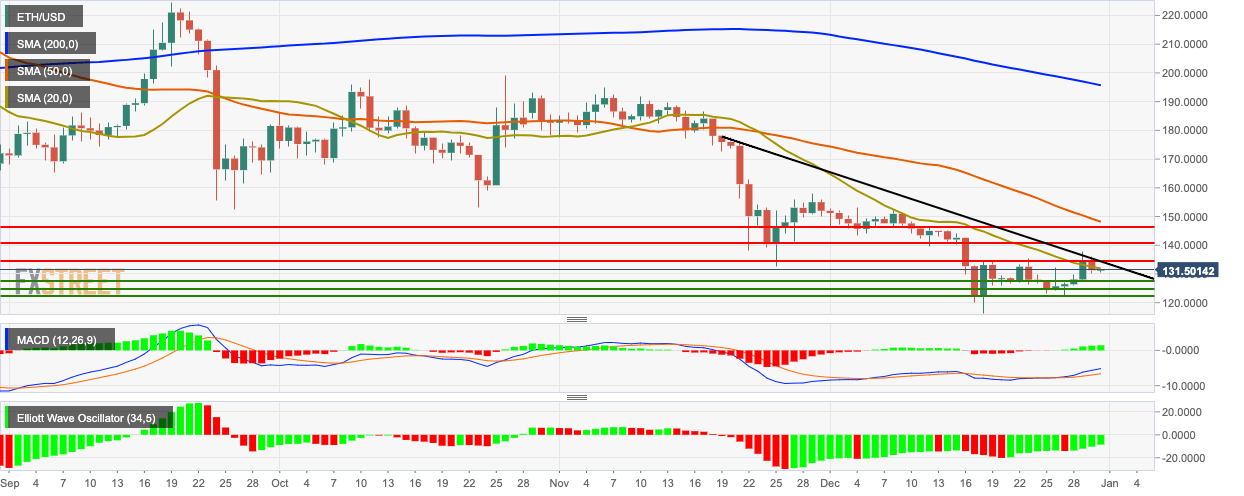
ETH/USD fell from $134.50 to $131.25 this Monday, following four straight bullish days, which say the price rise from $125.15 to $134.50. The price has risen to $131.45 in the early hours of Tuesday after bouncing off support at the 20-day Simple Moving Average (SMA 20) curve. The Elliott Oscillator has had 10 green sessions out of the last 11, while the Moving Average Convergence/Divergence (MACD) indicates increasing bullish momentum. Both these tools show that despite this Friday’s bearish movement, the overall sentiment of Ethereum is definitely bullish.
Author

Rajarshi Mitra
Independent Analyst
Rajarshi entered the blockchain space in 2016. He is a blockchain researcher who has worked for Blockgeeks and has done research work for several ICOs. He gets regularly invited to give talks on the blockchain technology and cryptocurrencies.


