Ethereum Market Update: ETH to outperform BTC and hit $7,500 during the next bull cycle
- Ethereum may reach $7,500 if Bitcoin hits $50,000, expert believes.
- ETH/BTC stopped within a whisker of the channel support.
- ETH/USD needs to regain ground above $240.00.

ETH/USD is changing hands at $223.40, down over 5% in the recent 24 hours. The second-largest digital coin hit the intraday low at $218 before fresh buying interest helped to push it back above $220.00. Despite the recovery, ETH is trading within a short-term bearish trend amid high volatility. Currently, Ethereum's market value is registered at $24.9 billion, while an average daily trading volume is $9 billion.
Why Ethereum may hit $7,500
A popular cryptocurrency expert and a co-founder of crypto-oriented venture capital firm Placeholder, Chris Burniske, believes that ETH/USD may hit $7,500 once the new cryptocurrency bull cycle starts.
In a series of tweets, he explained, why ETH would cost $7,500 if Bitcoin reached $50,000.
If BTC goes > $50,000 in the next cycle, and ETHBTC returns to its former ATH, then expect to see ETH > $7,500.
He also added that once the boom begins, the mainstream would perceive ETH ‘the new kid on the block’, Thus the coin would get an additional boost and eventually outperform BTC.
Given ETH's outperformance of BTC over its lifetime (chart below again), not to mention smaller network value and strong on-chain economies, I see every reason for ETHBTC to surpass ATHs.
ETH/BTC: Technical picture
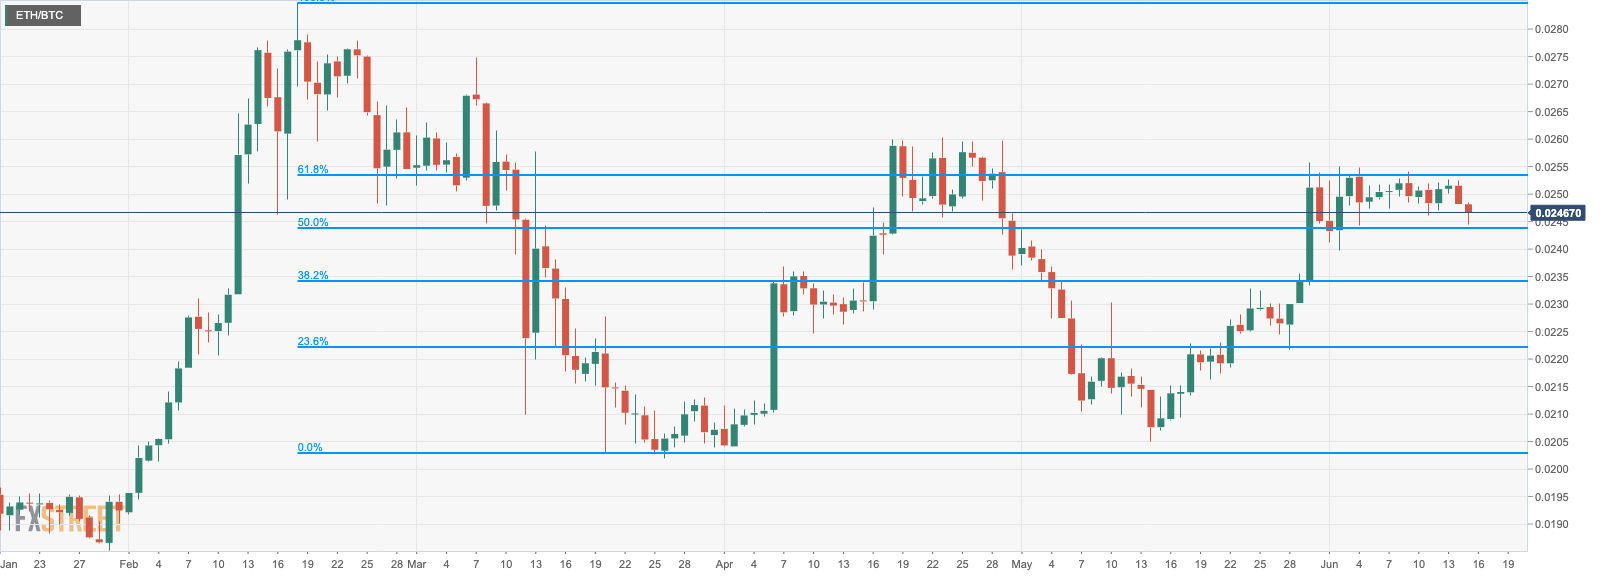
Meanwhile, ETH/BTC continues oscillating in a range limited by 61.8% and 50.0% Fibo retracement for the downside move from February 2020 high. The price came close to the lower border of the range at 0.0243 BTC during early Asian hours and recovered to $0.0246 by press time. If the channel support gives way, the sell-off may be extended towards $0.0240 and $0.0239, which is the lowest level since June 2.
On the upside, the recovery is effectively capped by psychological $0.02500 and 61.8% Fibo at $0.0253.
ETH/BTC daily chart
ETH/USD: Technical picture
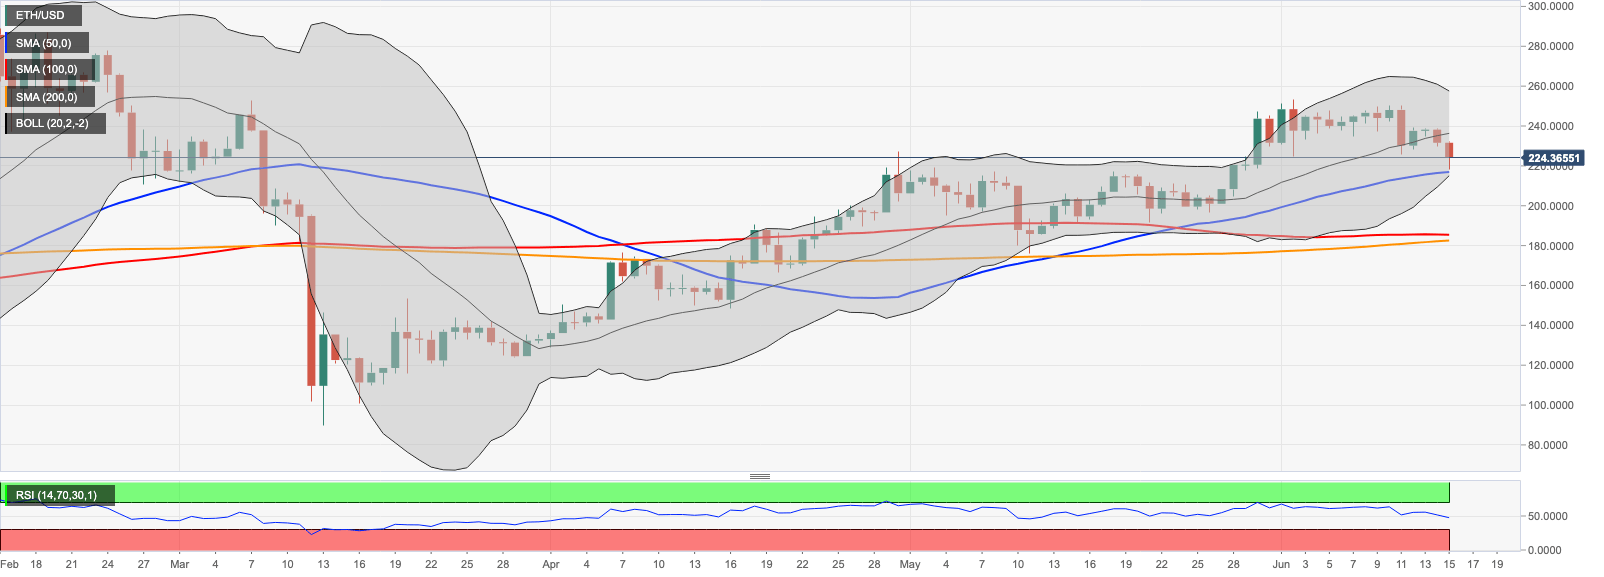
On a daily chart, ETH/USD is supported by daily SM50 at $217.00. Once it is out of the way, the downside is likely to gain traction with the next focus on psychological $200.00 followed by a combination of daily SMA100 and SMA200 At $185.00. On the upside, a sustainable move above $240.00 is needed for the upside to gain traction. However, the downward-looking RSI on a daily chart implies that the bearish scenario is more likely at this stage.
ETH/USD daily chart
Author

Tanya Abrosimova
Independent Analyst



