Ethereum ETFs record longest outflow streak, exchange net flow indicates mounting selling pressure
- Ethereum ETFs record their longest outflow streak with five days of consecutive negative flows.
- Ethereum exchange net flow has increased to 31K ETH, its highest since the market crash on August 5.
- Vitalik Buterin says Ethereum is growing based on several key metrics.
- Ethereum technical indicators suggest a range-bound movement amid mixed sentiments from futures traders and fund investors.

Ethereum (ETH) is down 1% on Thursday as its ETF and exchange net flows suggest that sellers dominate the market. Despite the selling pressure, Ethereum co-founder Vitalik Buterin shared a post depicting its growth across several metrics.
Daily digest market movers: Ethereum ETF five-day outflow streak, positive exchange net flows, Vitalik's metrics
Ethereum ETFs recorded its longest negative flows streak — five consecutive days — on Wednesday after posting outflows of $18 million.
The flows were spearheaded by outflows of $31.1 million in Grayscale's ETHE, bringing its cumulative outflows since launch to over $2.5 billion. ETHA accompanied its milestone of over $1 billion in cumulative net inflows with zero flows on Wednesday.
With the consistent negative flows, Ethereum ETFs could record another week of net outflows as cumulative flows since Monday have amounted to $38 million in outflows.
A similar trend is occurring with ETH exchange flows. Unlike ETF flows, positive exchange net flows indicate selling pressure is rising and may lead to price declines.
Ethereum net exchange inflow increased to 31K ETH on Thursday, its highest since the market crash on August 5. The 7-day moving average exchange netflow has also been rising since August 11.
 - All Exchanges (SMA 7)-638599513994141136.png)
ETH Exchange Net Flow
Meanwhile, Ethereum co-founder Vitalik Buterin shared an X post with several metrics suggesting that ETH has continued on its growth path. Some of the points he highlighted include the following:
- Increased staking decentralization.
- Improvement in cross-L2 wallet user experience (UX).
- More clarity on account abstraction roadmap.
- Mature zero-knowledge (ZK) tooling and many others.
"The fundamentals for Ethereum are actually crazy strong right now," noted Buterin.
Ethereum has gotten stronger:
— vitalik.eth (@VitalikButerin) August 22, 2024
* Under $0.01 txfees on L2
* Two EVM L2s (@Optimism @arbitrum) now at stage 1
* Cross-L2 wallet UX has improved a lot (eg. no more manually switching networks), though still a long way to go
* Much more powerful and mature ZK tooling making life… pic.twitter.com/4jQGeZ3qEA
ETH technical analysis: Ethereum could continue range-bound movement
Ethereum is trading around $2,610 on Thursday, down 1% on the day. In the past 24 hours, ETH has seen $31.34 million in liquidations, with long and short liquidations accounting for $24.1 million and $7.24 million, respectively.
Ethereum is consolidating on the 4-hour chart, where the 200-day Simple Moving Average (SMA) serves as support to prevent further price declines. Before prices could rally, ETH needs to overcome the $2,775 resistance which — coupled with the 50-day SMA — has prevented any upward attempt.
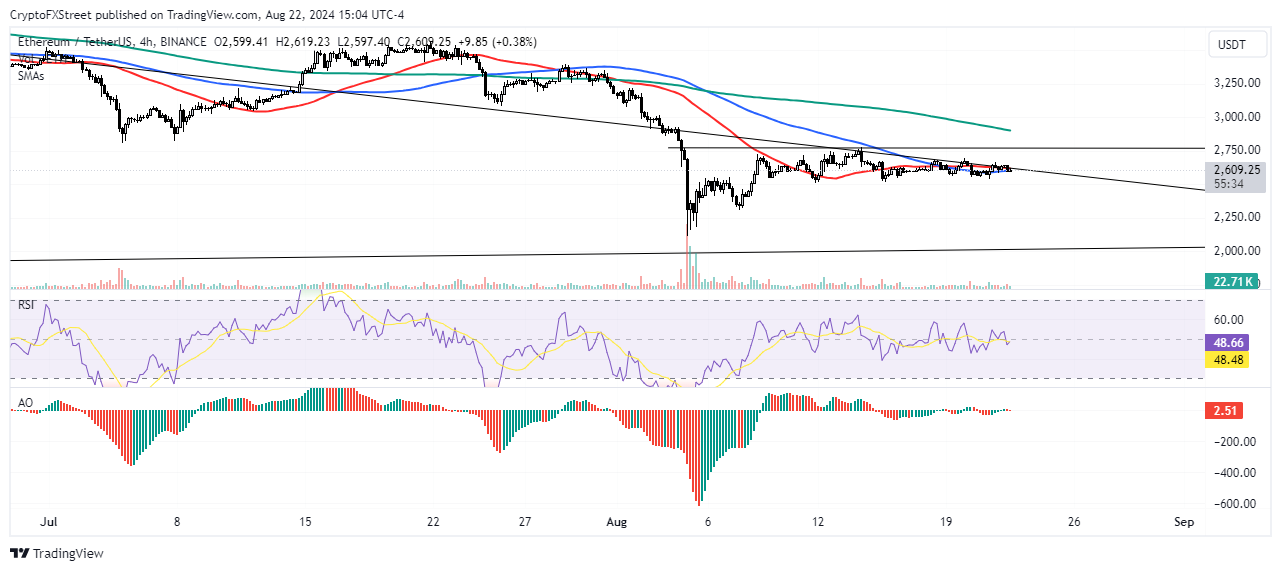
ETH/USDT 4-hour chart
The ETH Long/Short Ratio at 0.96 shows sellers dominate the market. Still, relatively strong buying pressure from Coinbase and Ethereum Funds investors, as evidenced by their premiums of 0.024 and 0.38, respectively, has kept prices on a horizontal trend.
ETH will likely remain range-bound with a bias toward the downside, as depicted by a key trendline extending from May 29 to September 27.
The Relative Strength Index (RSI) has moved below its midline at 48, indicating neutrality in momentum. The Awesome Oscillator (AO) also aligns with the neutral sentiment, posting short bars just shy above zero.
In the short term, ETH could rise to $2,666 to liquidate positions worth $65 million.
Ethereum FAQs
Ethereum is a decentralized open-source blockchain with smart contracts functionality. Serving as the basal network for the Ether (ETH) cryptocurrency, it is the second largest crypto and largest altcoin by market capitalization. The Ethereum network is tailored for scalability, programmability, security, and decentralization, attributes that make it popular among developers.
Ethereum uses decentralized blockchain technology, where developers can build and deploy applications that are independent of the central authority. To make this easier, the network has a programming language in place, which helps users create self-executing smart contracts. A smart contract is basically a code that can be verified and allows inter-user transactions.
Staking is a process where investors grow their portfolios by locking their assets for a specified duration instead of selling them. It is used by most blockchains, especially the ones that employ Proof-of-Stake (PoS) mechanism, with users earning rewards as an incentive for committing their tokens. For most long-term cryptocurrency holders, staking is a strategy to make passive income from your assets, putting them to work in exchange for reward generation.
Ethereum transitioned from a Proof-of-Work (PoW) to a Proof-of-Stake (PoS) mechanism in an event christened “The Merge.” The transformation came as the network wanted to achieve more security, cut down on energy consumption by 99.95%, and execute new scaling solutions with a possible threshold of 100,000 transactions per second. With PoS, there are less entry barriers for miners considering the reduced energy demands.
Author

Michael Ebiekutan
FXStreet
With a deep passion for web3 technology, he's collaborated with industry-leading brands like Mara, ITAK, and FXStreet in delivering groundbreaking reports on web3's transformative potential across diverse sectors. In addition to