Ethereum Elliott Wave technical analysis [Video]
![Ethereum Elliott Wave technical analysis [Video]](https://editorial.fxsstatic.com/images/i/ETH-neutral-line.png)
Elliott Wave analysis TradingLounge
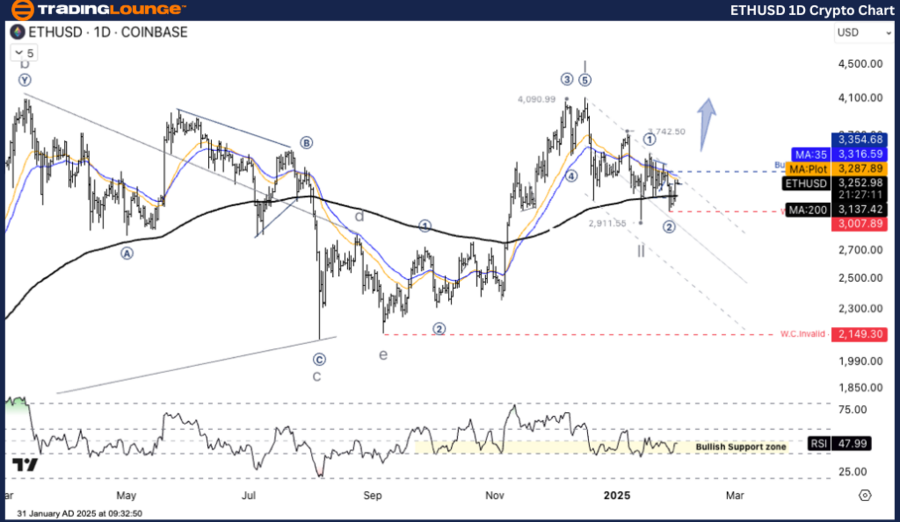
ETH/USD Elliott Wave technical analysis
Function: Counter Trend
Mode: Corrective
Structure: Zigzag
Position: Wave C
Direction Next higher Degrees: Wave II
Ethereum/ US Dollar (ETHUSD) trading strategy: ETH/USD is in a correction phase of Wave (2). If the price holds above the key support level, there is a high chance of entering Wave (3) with a new uptrend target. Investors should closely monitor price movements near the 3,007.89 USD and 3,354.68 USD levels.
Trading strategies
Buy strategy (long position):
- If the price holds above 3,007.89 USD and breaks through the Bullish Level (3,354.68 USD), it will confirm that ETH is entering Wave (3), which is a new uptrend.
Risk management:
- If the price drops below 3,007.89 USD, it may test the next support level at 2,911.55 USD or worse, it may adjust to 2,149.30 USD.
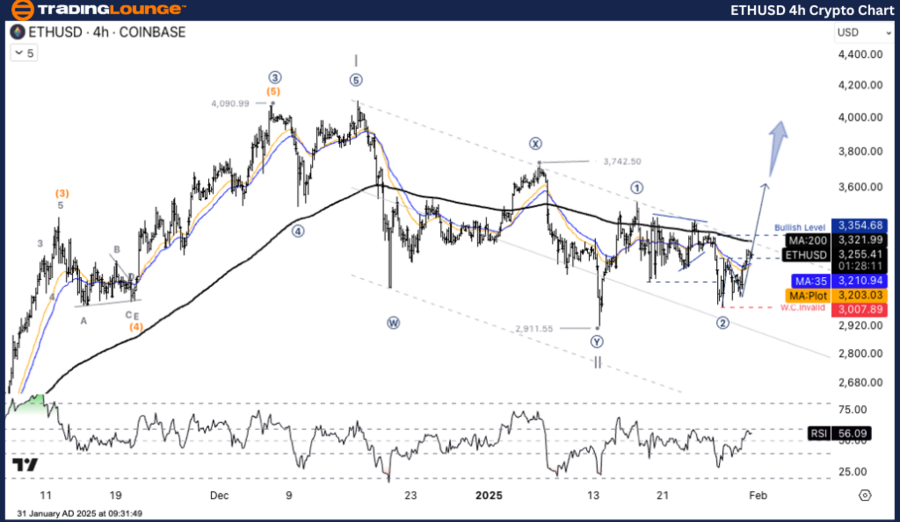
ETH/USD Elliott Wave technical analysis
Function: Counter Trend
Mode: Corrective
Structure: Zigzag
Position: Wave C
Direction next higher degrees: Wave II
Ethereum/ US Dollar (ETH/USD) trading strategy: ETH/USD is in a correction phase of Wave (2). If the price holds above the key support level, there is a high chance of entering Wave (3) with a new uptrend target. Investors should closely monitor price movements near the 3,007.89 USD and 3,354.68 USD levels.
Trading strategies
Buy strategy (long position):
- If the price holds above 3,007.89 USD and breaks through the Bullish Level (3,354.68 USD), it will confirm that ETH is entering Wave (3), which is a new uptrend.
Risk management:
- If the price drops below 3,007.89 USD, it may test the next support level at 2,911.55 USD or worse, it may adjust to 2,149.30 USD.
Ethereum Elliott Wave technical analysis [Video]
Author

Peter Mathers
TradingLounge
Peter Mathers started actively trading in 1982. He began his career at Hoei and Shoin, a Japanese futures trading company.


