Top Crypto Gainers: World Liberty Financial, MemeCore and Quant gain momentum
- World Liberty Financial extends its recovery by nearly 3% on Tuesday for the third consecutive day.
- MemeCore is up nearly 10% over the last 24 hours, recovering from the 28% decline on Sunday.
- Quant extends a V-shaped recovery toward $70 on Tuesday after a 6% jump the previous day.

World Liberty Financial (WLFI), MemeCore (M), and Quant (QNT) are leading gains over the last 24 hours as the broader cryptocurrency market stabilizes after last week’s correction. Still, the technical outlook for altcoins remains mixed due to prevailing downside pressure and vulnerable market sentiment.
World Liberty Financial records a short-term recovery
World Liberty Financial extended its recovery by over 2% at press time on Tuesday, extending the 4% gains from Monday. This marks the third consecutive day of recovery for WLFI after a four-day decline of nearly 25%.
The technical indicators on the daily chart suggest an easing in selling pressure. The Moving Average Convergence Divergence (MACD) takes a lateral shift below the zero line as the histogram contracts, suggesting a reduced bearish momentum. Meanwhile, the Relative Strength Index (RSI) rises to 32, exiting oversold conditions, but remains under the prevailing pressure.
A steady recovery in WLFI could target the $0.1215 level marked by the December 18 low.
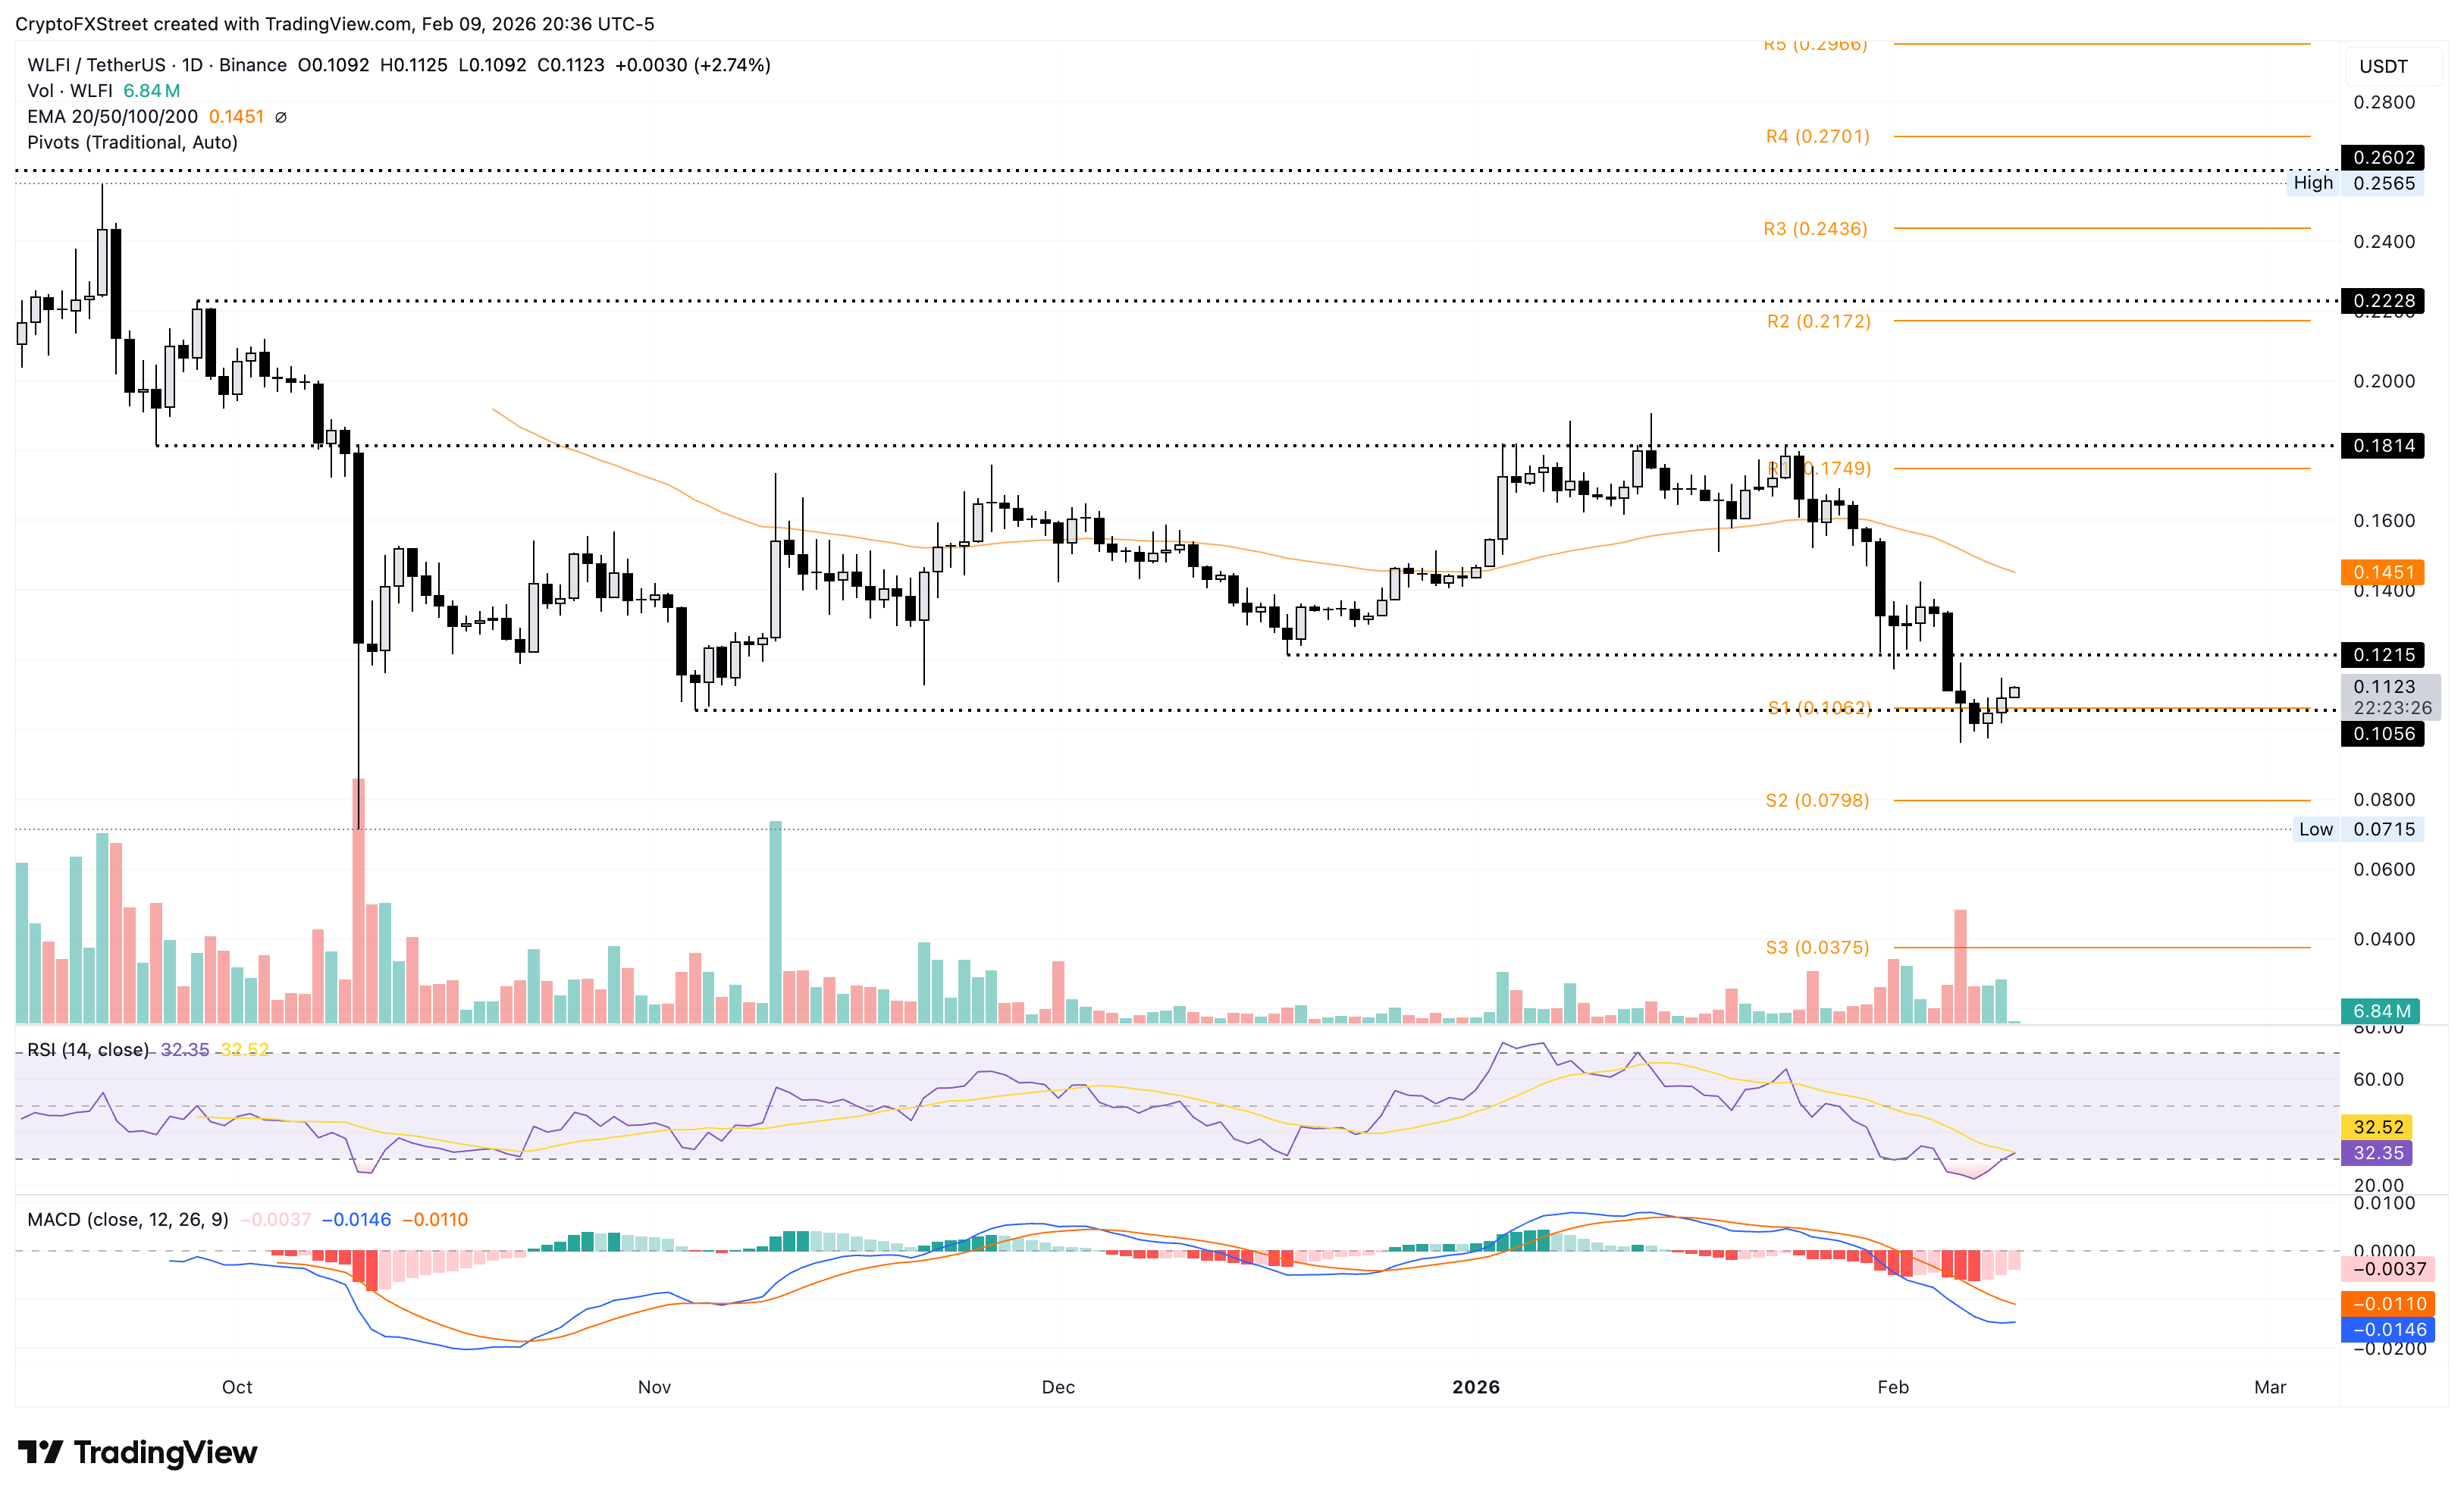
On the flip side, a reversal below the $0.10 psychological mark could test the October 10 low at $0.0715.
MemeCore scrapes gains after Sunday’s drop
MemeCore is up nearly 4% on Tuesday, extending the 7% recovery from Monday. This marks a bullish start to the week after suffering a 28% decline on Sunday.
The meme coin trades below the 200-day Exponential Moving Average (EMA), which could cap short-term gains. However, a daily close above this average line could target the 50-day EMA at $1.56.
The technical indicators on the daily chart maintain a neutral tone, with the RSI at 48 hovering near the neutral zone and the MACD and signal line remaining convergent.
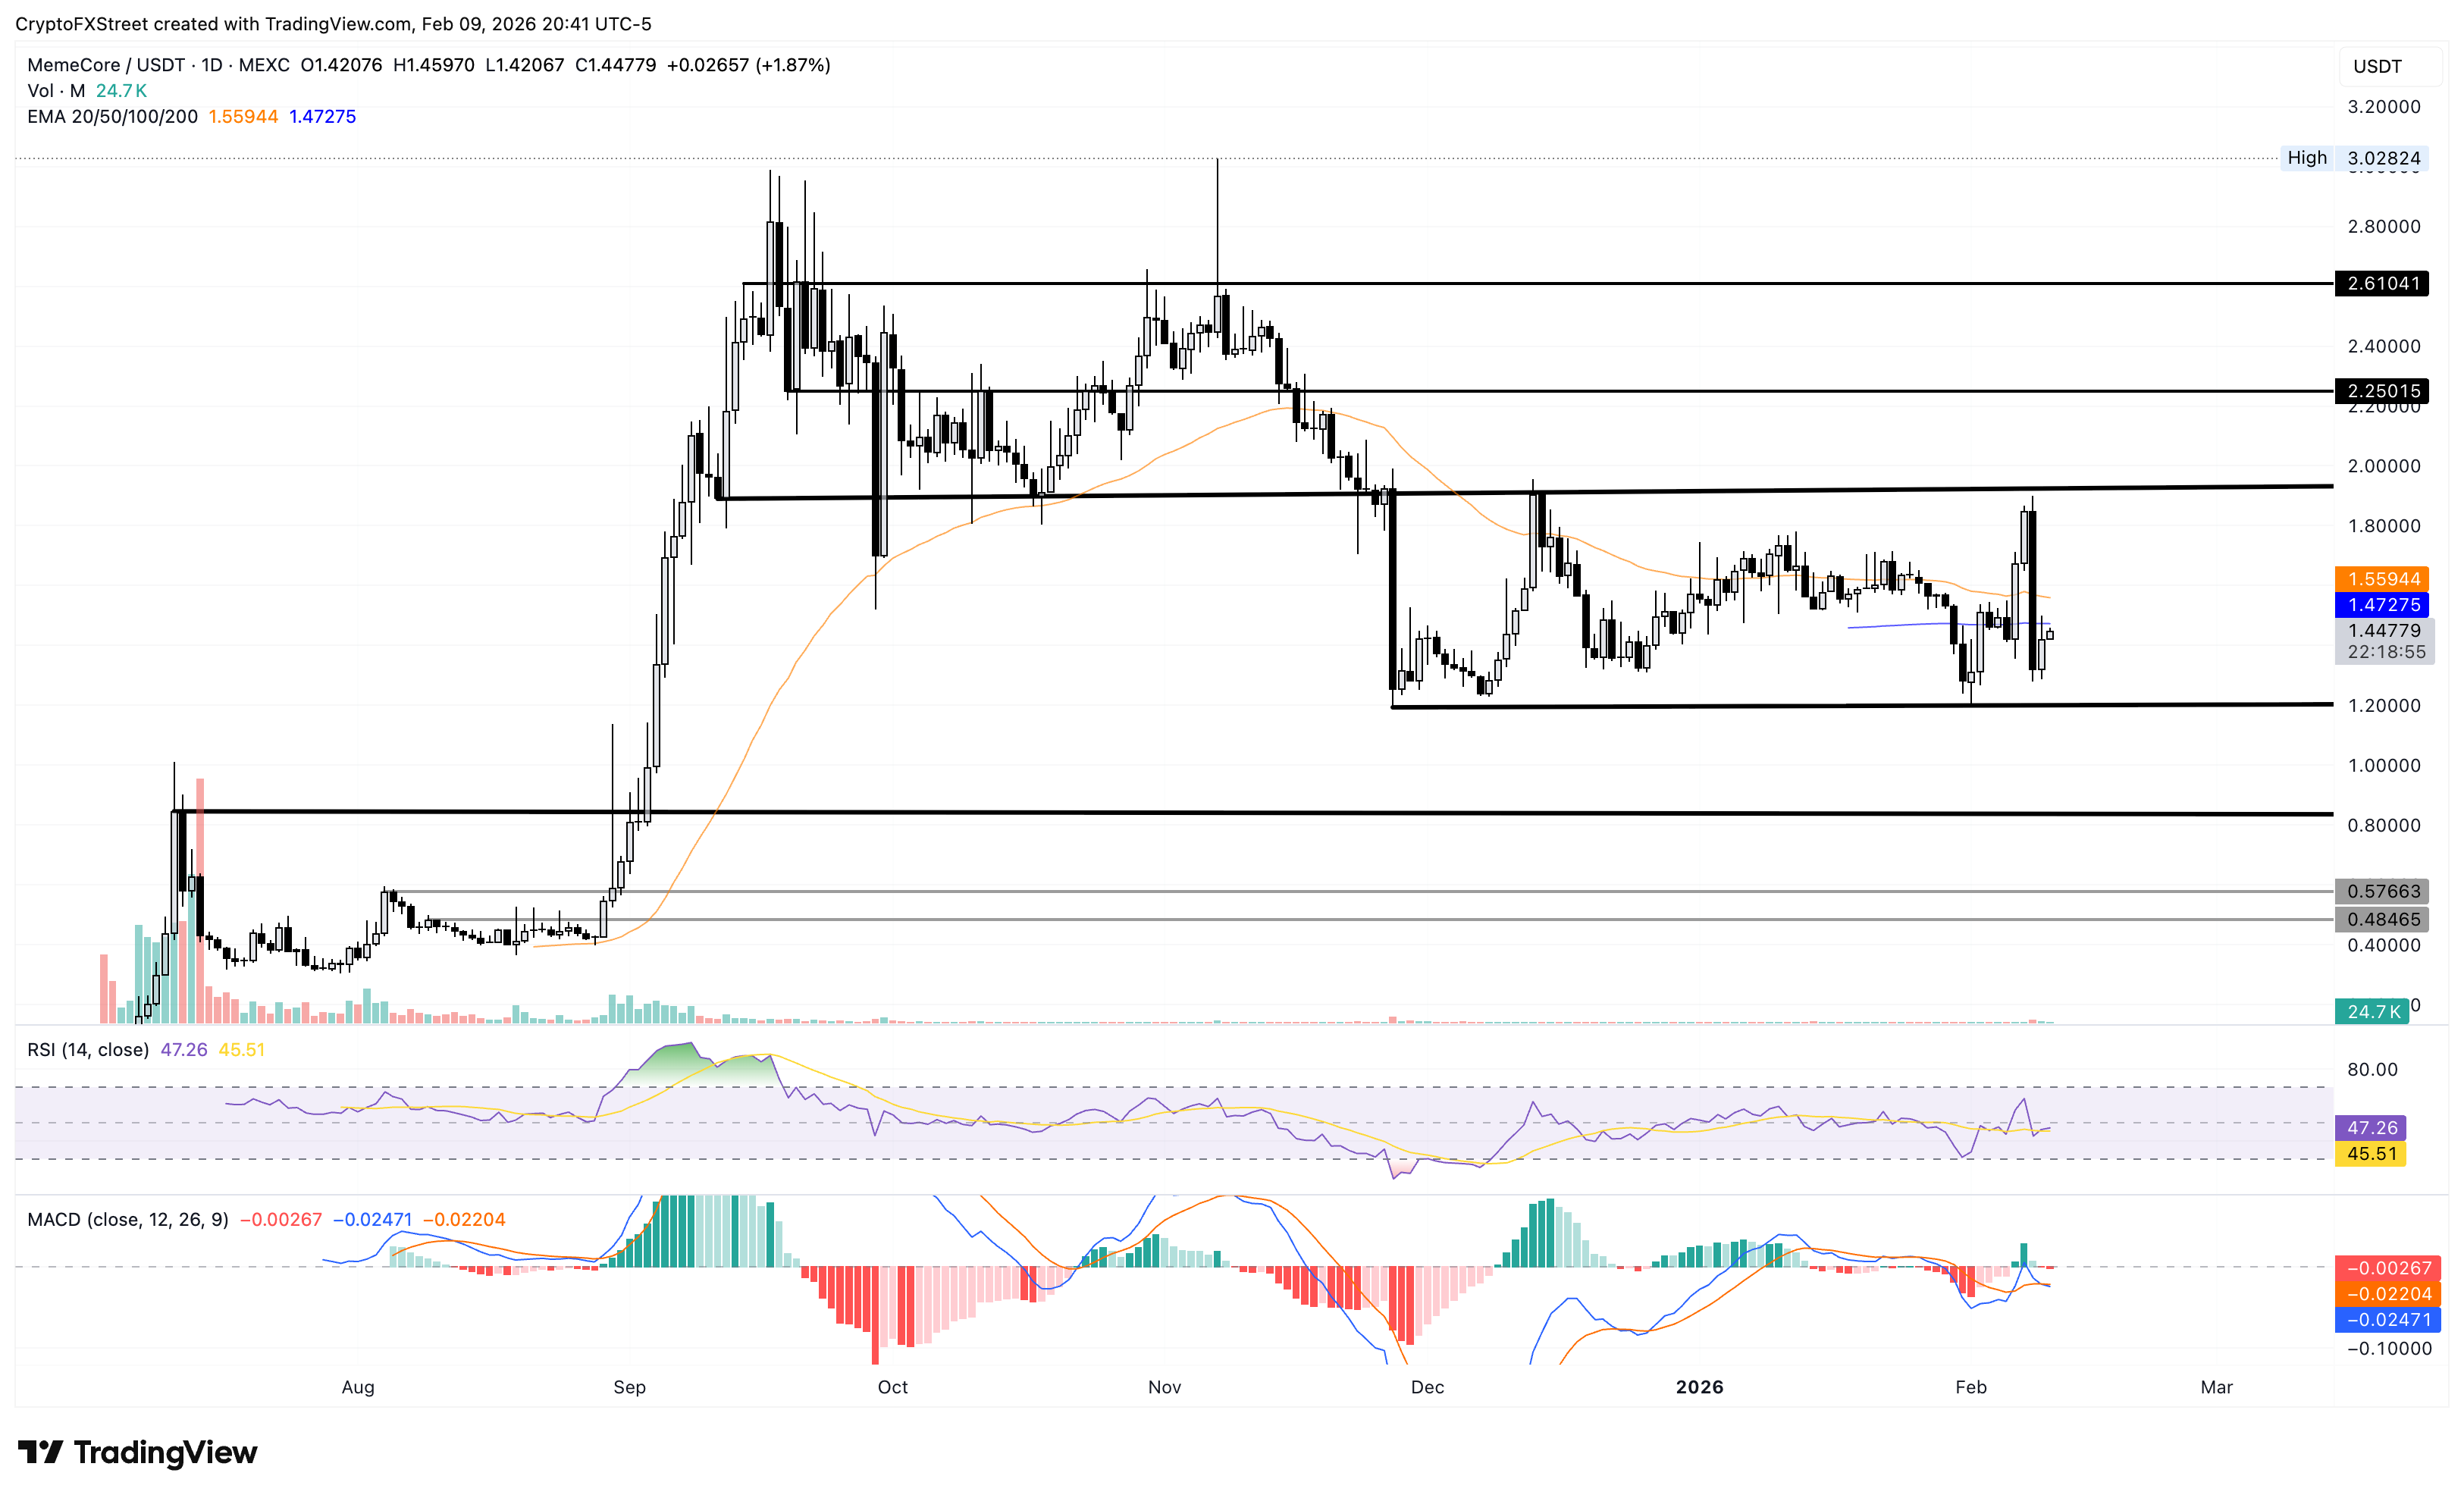
On the downside, the $1.19 support level, which aligns with the February 1 low, could prove crucial.
Quant recovers amid easing downside pressure
Quant trades above $70.00 at the time of writing on Tuesday, holding the 6% gain from the previous day. However, QNT trades below the 50-day EMA at $73.90, which is lower than the 200-day EMA at $84.62, indicating a prevailing bearish trend.
If Quant clears the shorter moving average, it could target the longer-term EMA.
The QNT recovery run begins as selling pressure eases, as evidenced by the RSI rising to 48, above the oversold boundary. Meanwhile, the MACD recovery converges with the signal line, indicating a potential bullish crossover.
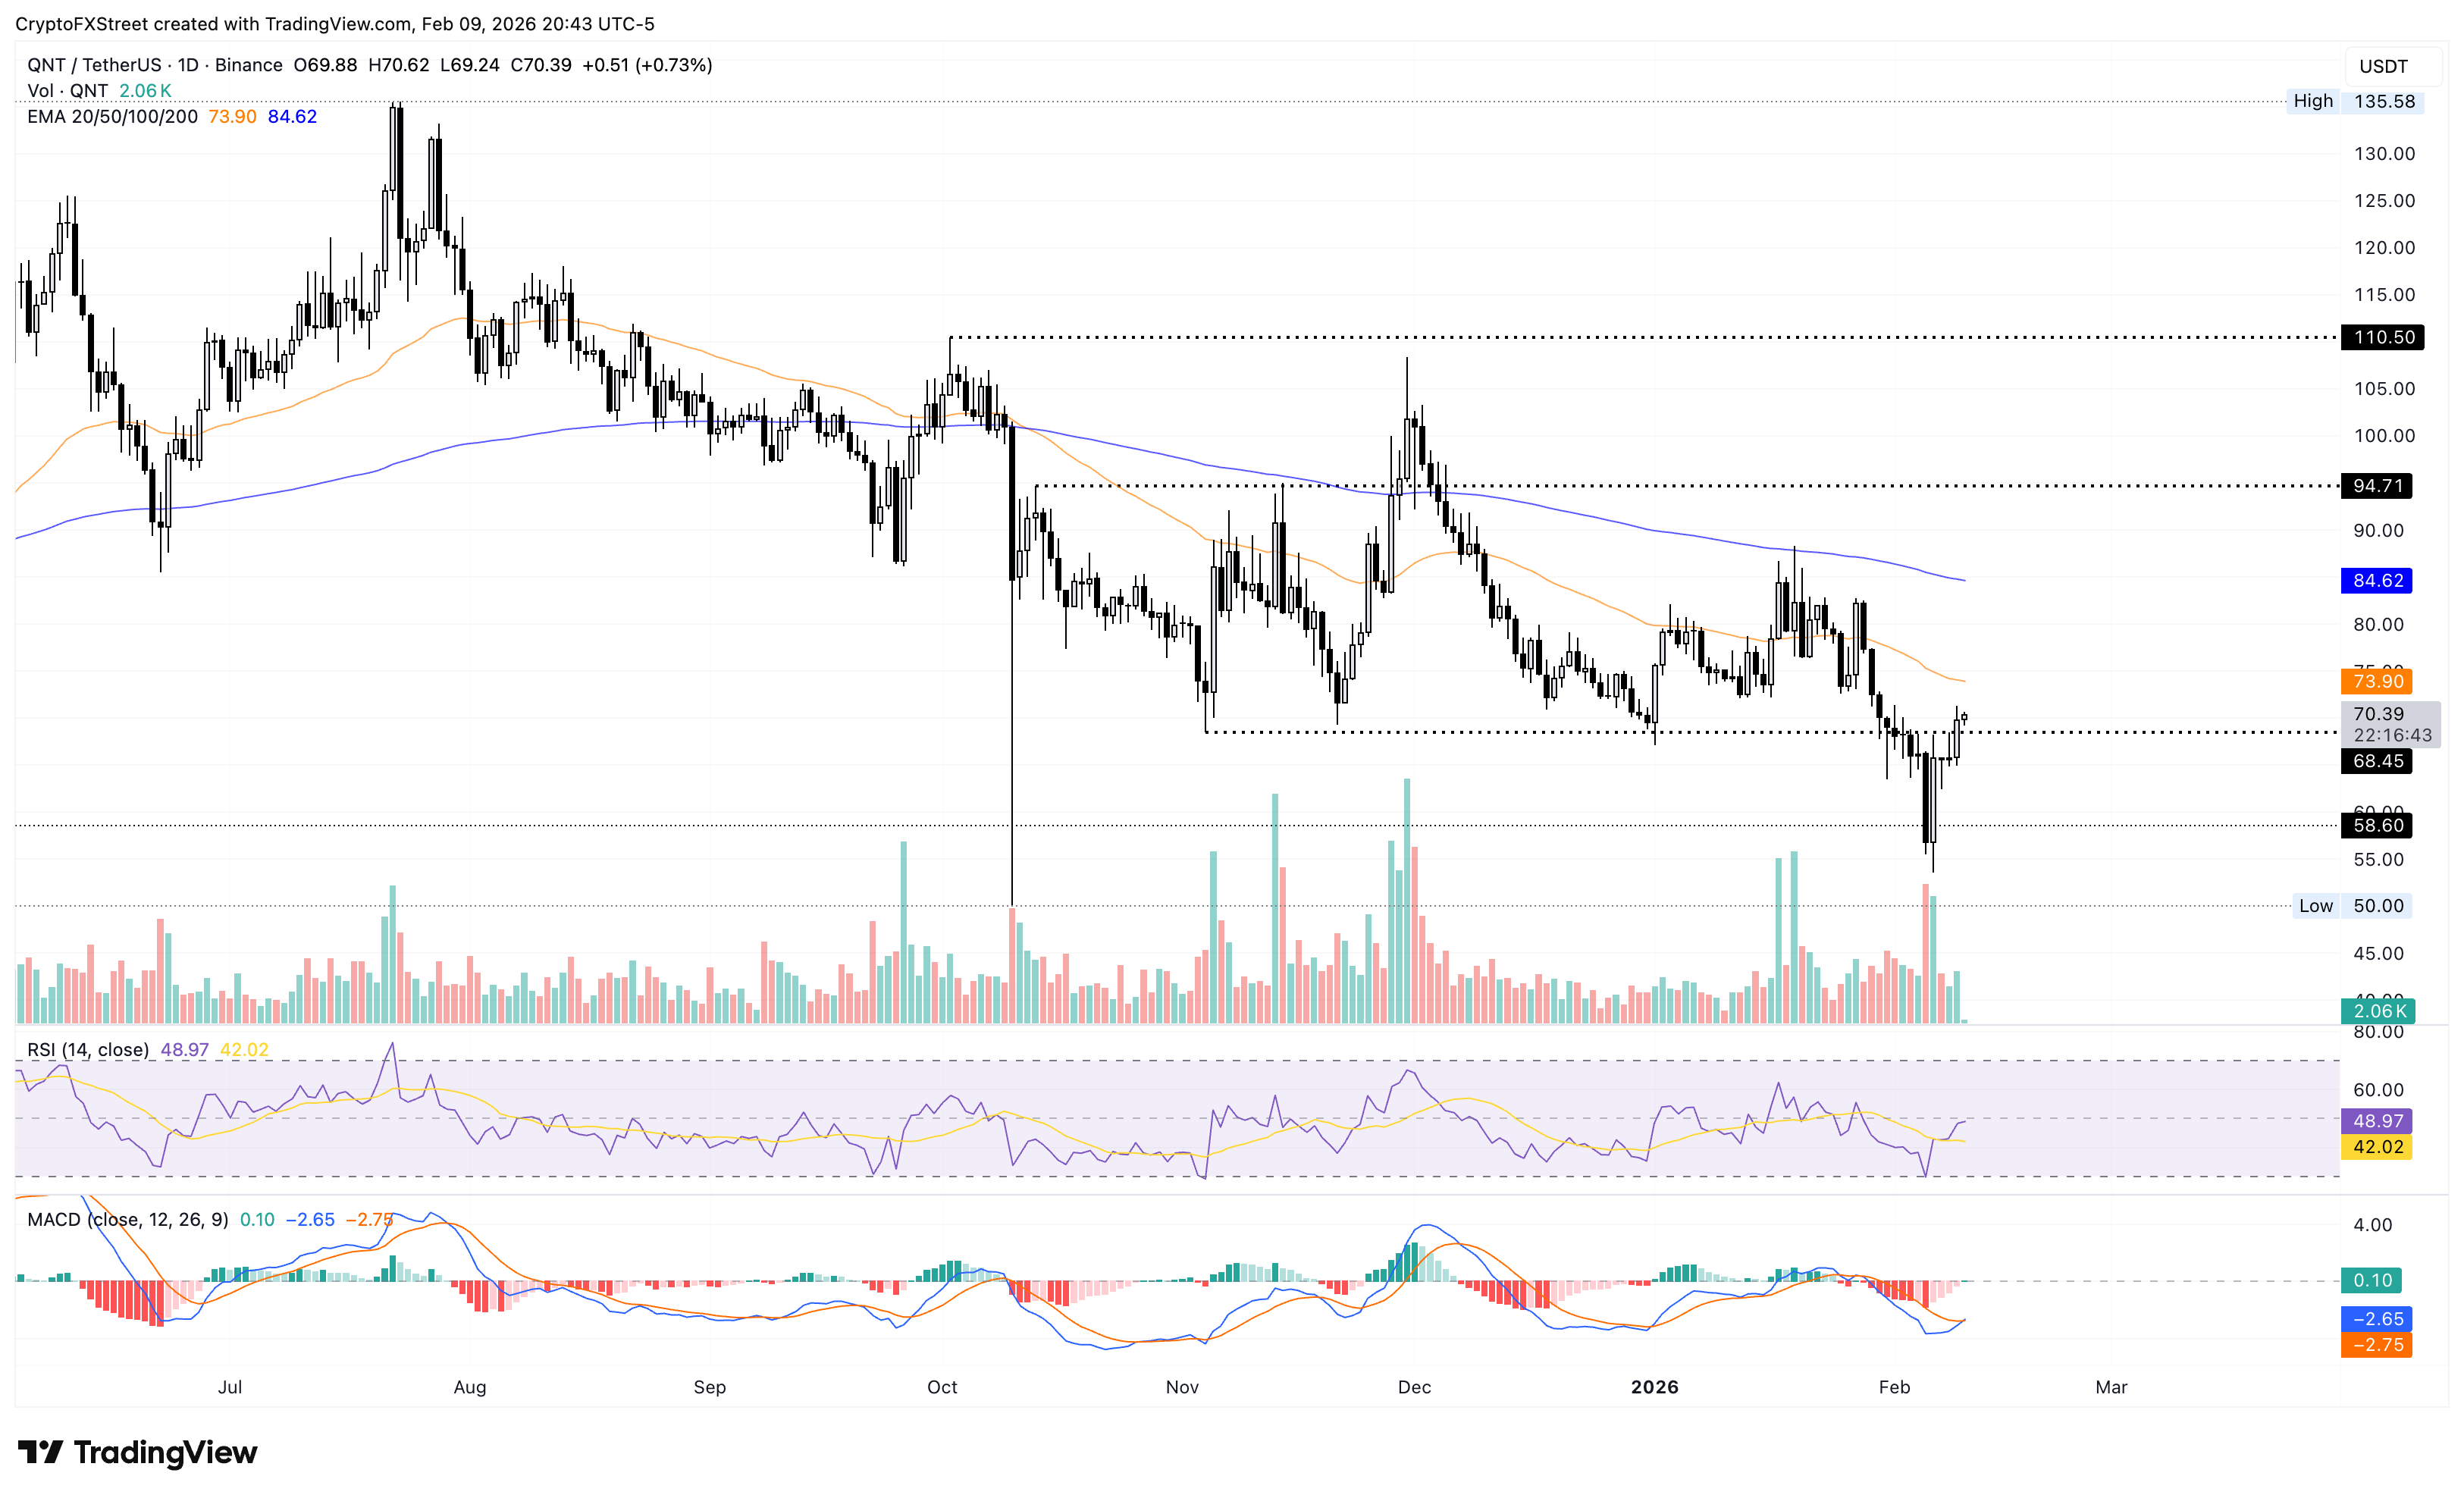
On the flip side, if Quant drops below the November 4 low at $68.45, it could extend the decline toward the $60 round figure.
Author

Vishal Dixit
FXStreet
Vishal Dixit holds a B.Sc. in Chemistry from Wilson College but found his true calling in the world of crypto.




