LayerZero Price Prediction: ZRO recovery defies bear market despite on-chain activity drop
- LayerZero gains roughly 7% on Tuesday, marking its fifth consecutive day of recovery.
- ZRO remains among the fastest-recovering crypto assets despite the broader cryptocurrency market's plunge last week.
- On-chain data show a sharp decline in daily transactions and active users, decoupling from the ZRO price rally.

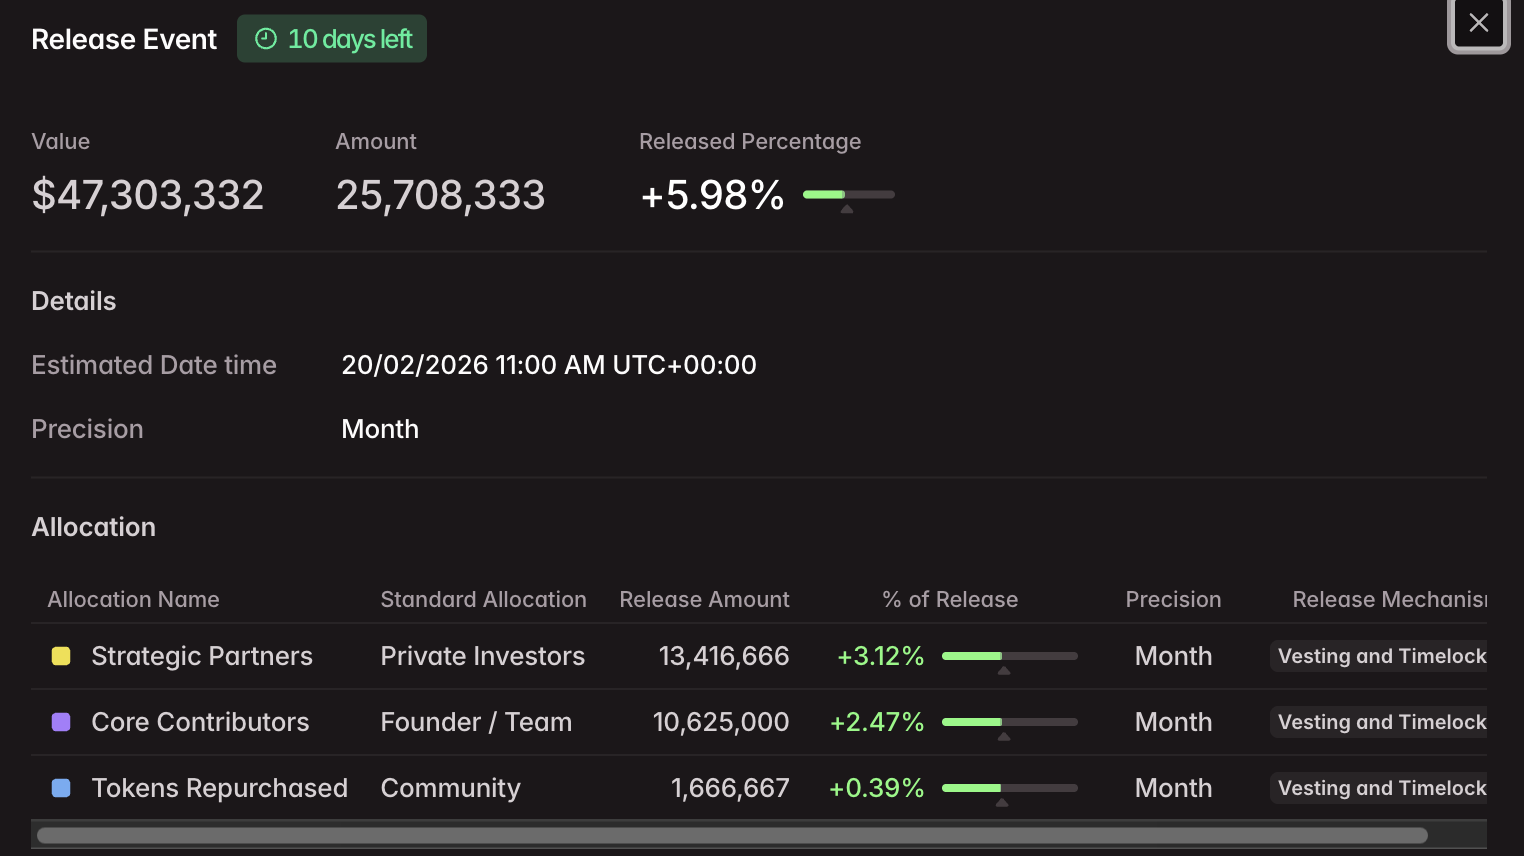
LayerZero (ZRO) remains one of the best-performing crypto assets over the last seven days, edging higher by nearly 7% at press time on Tuesday. The cross-chain messaging layer rallies amid intense retail interest, despite a sharp decline in on-chain activity. However, the 25.70 million tokens scheduled to unlock on February 20 add to downside risk.
Retail interest spikes in LayerZero, overlooking on-chain weakness
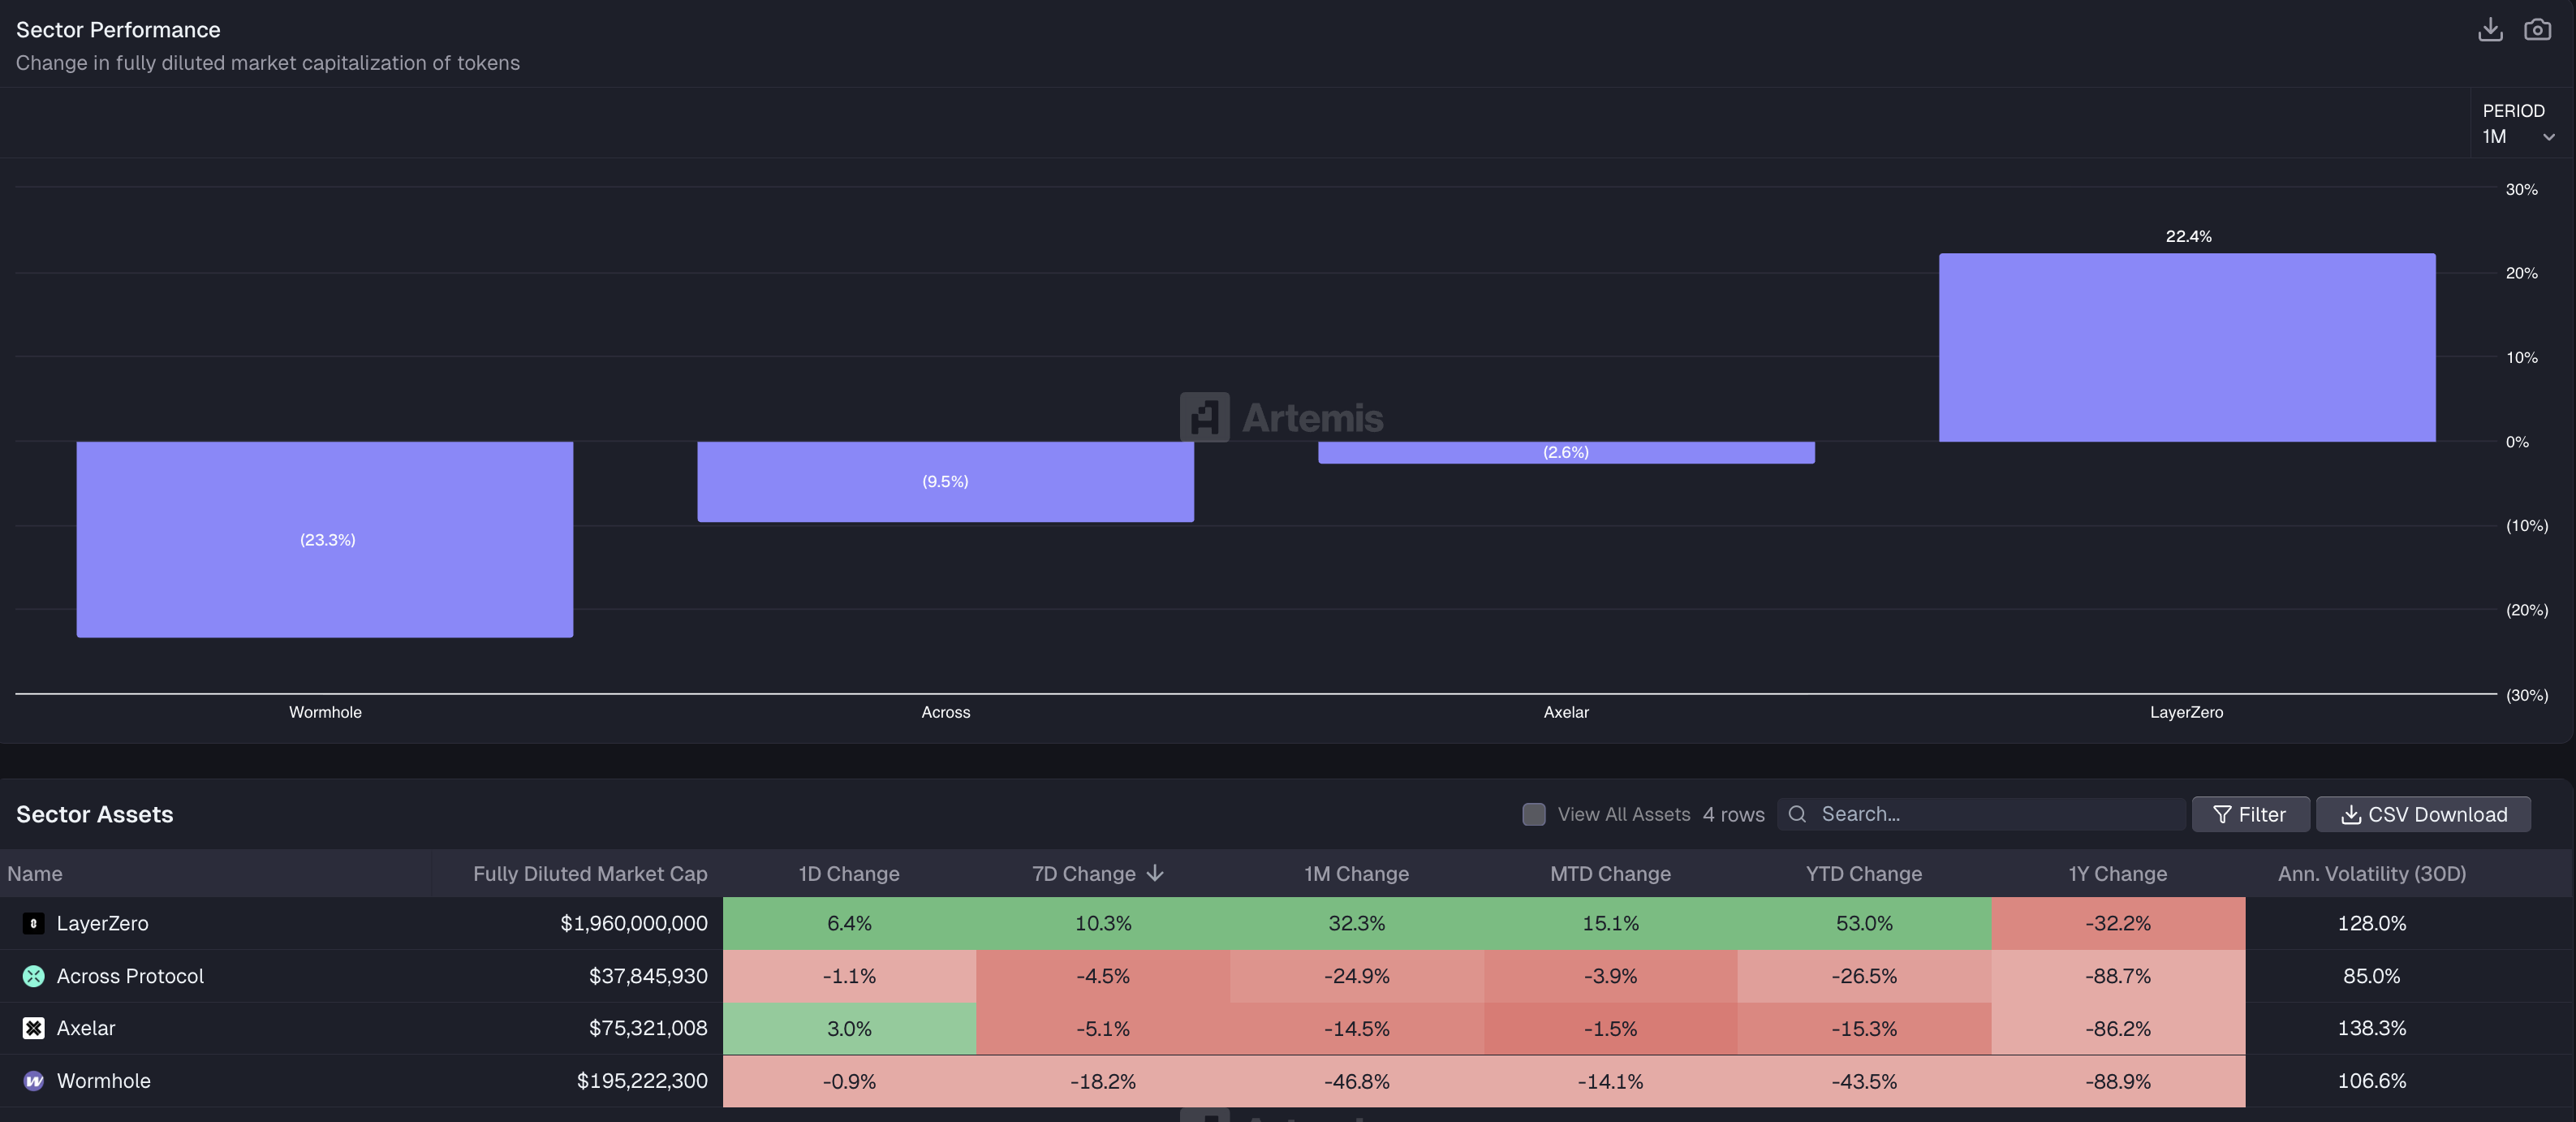
Artemis data show that bridge tokens, focused on cross-chain interoperability, outpaced the broader cryptocurrency market over the last seven days, driven mainly by LayerZero, which posted 10% weekly and 32% monthly gains.
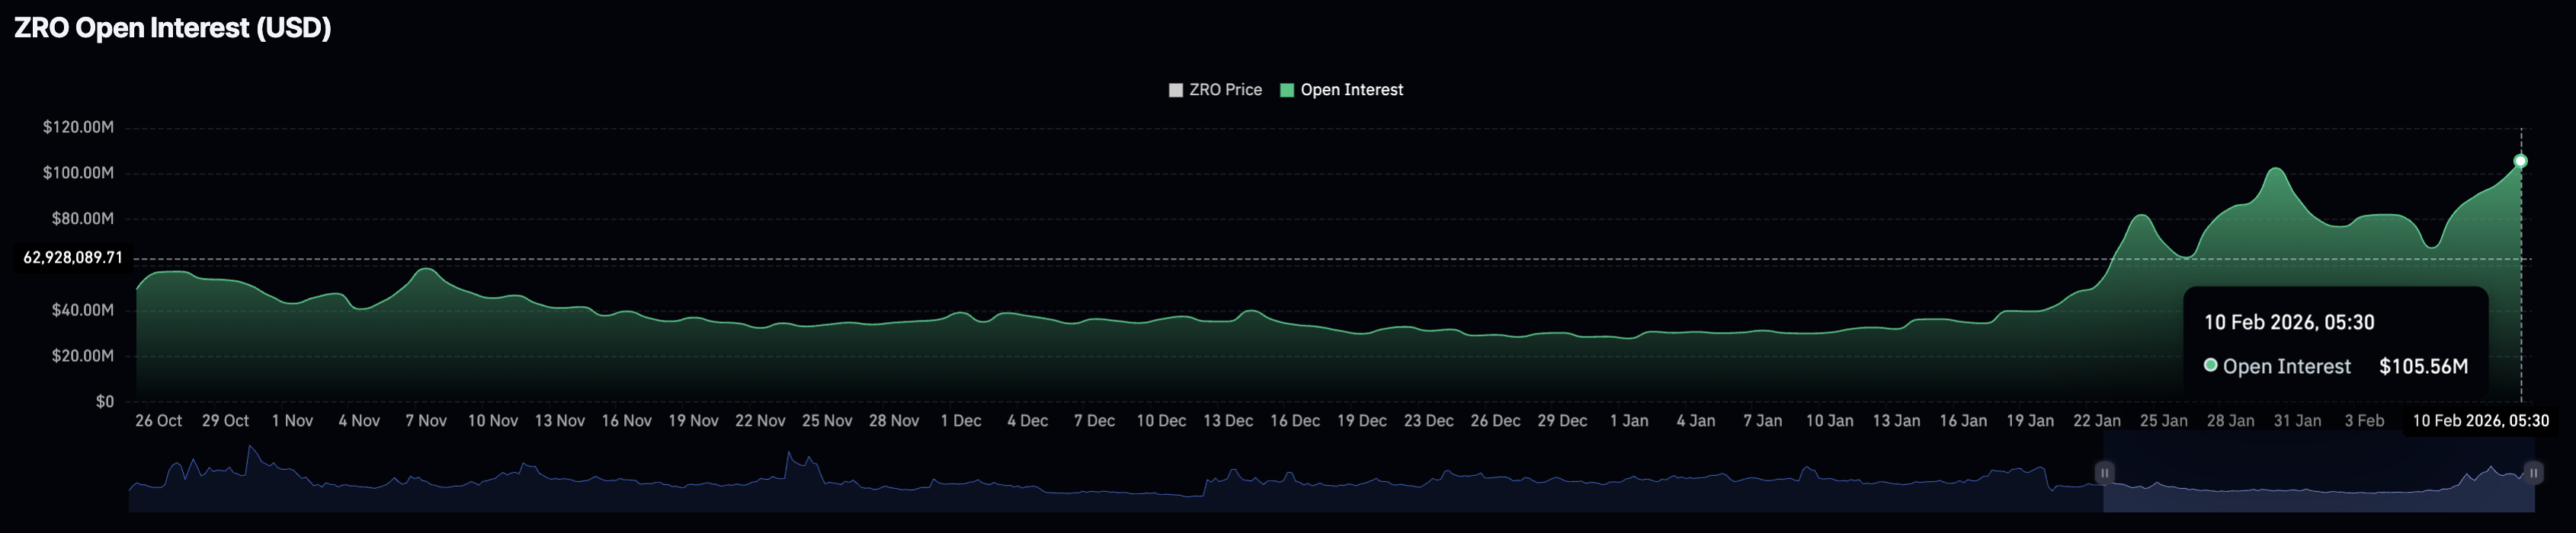
On the derivatives side, CoinGlass data shows a sharp increase in ZRO futures Open Interest (OI), rising to $105.56 million on Tuesday, the highest since December 2024, up from $95.78 million the previous day. An increase in the notional value of the outstanding contracts suggests capital inflow or greater leverage exposure.
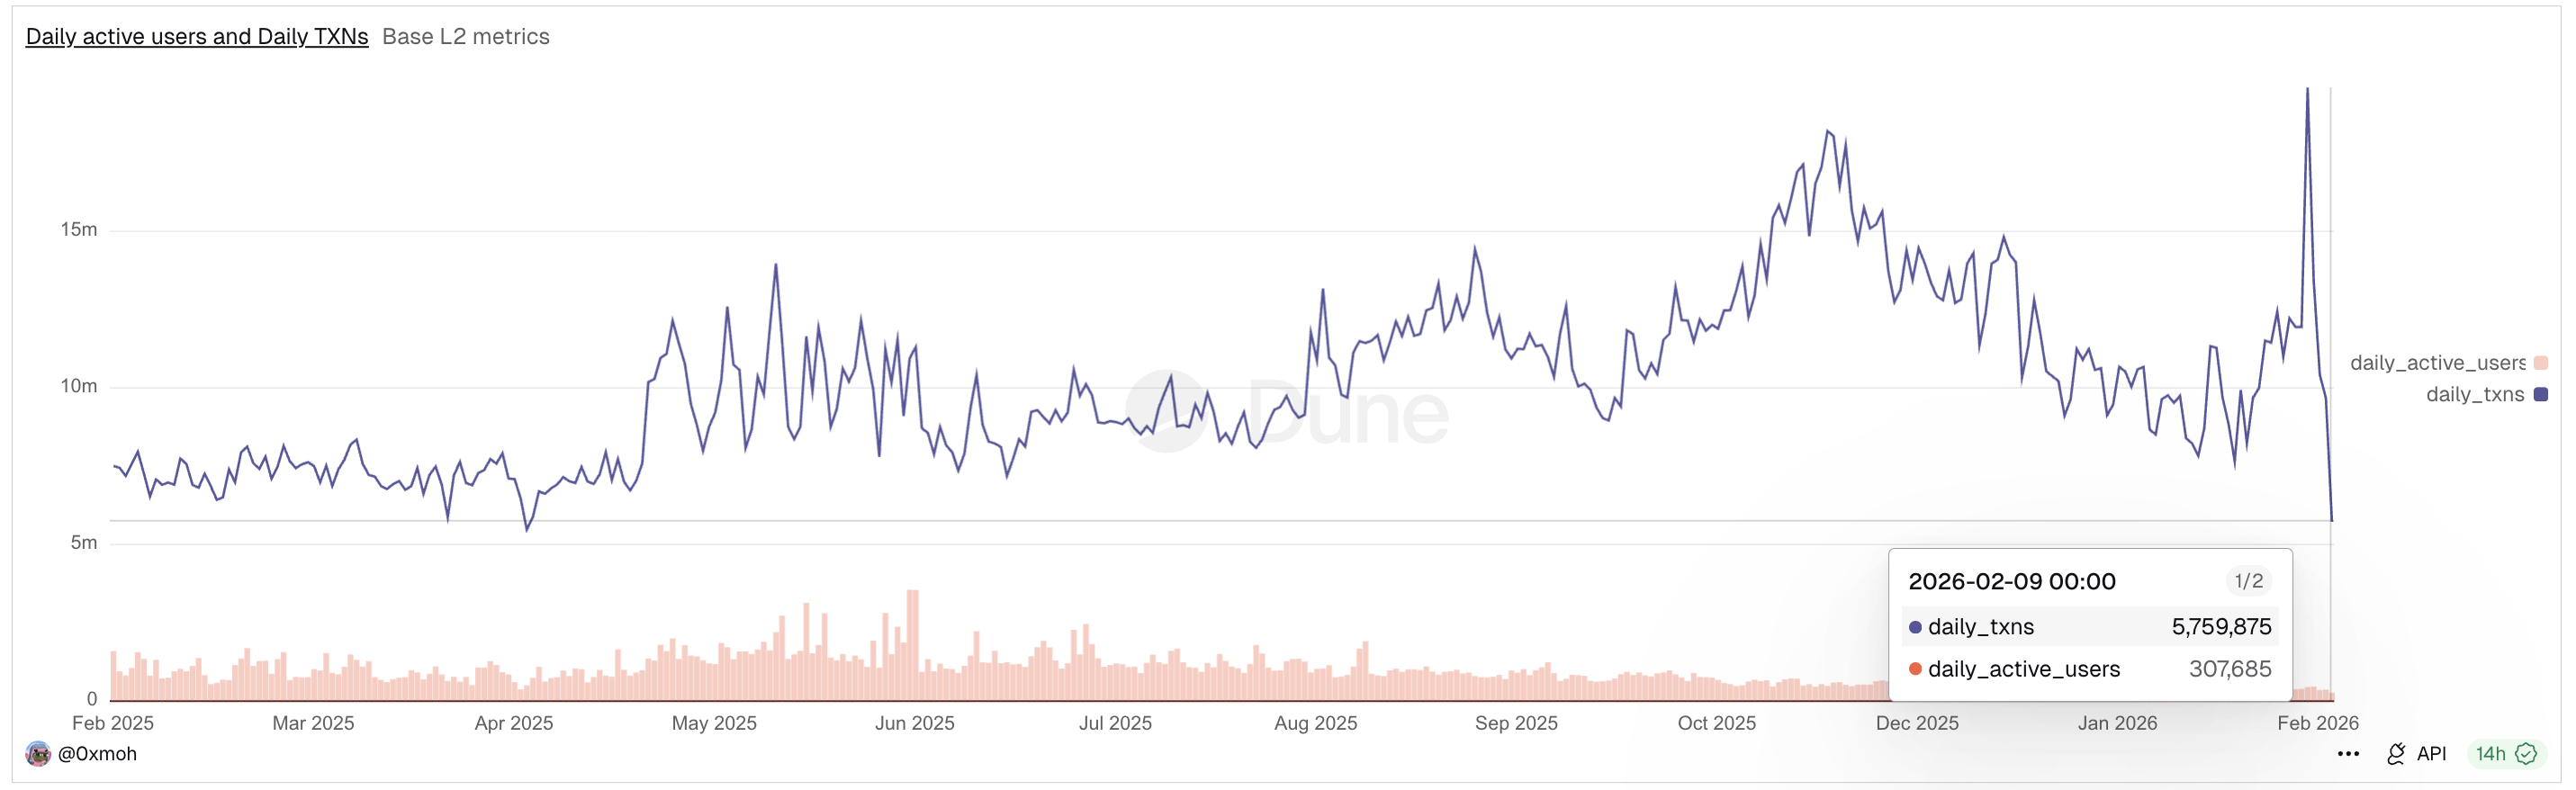
However, on-chain demand for LayerZero has dropped sharply over the same period. The Dune dashboard shows that daily transactions and active users are down to 5.75 million and 307,685, respectively, from Thursday’s peak of 19.59 million and 486,155. This is consistent with the broader market decline, as on-chain activity among top blockchain ecosystems has been adversely affected.
Additionally, the upcoming unlock of more than 25.70 million ZRO tokens in February, which would increase the circulating supply by 5.98%, could add to supply pressure. Typically, price jumps before an unlock pose a bull trap risk, boosting exit liquidity for the unlocked supply.
Historically, over the last three monthly token unlocks, LayerZero recovered in the subsequent week, suggesting that either retail demand absorbed the fresh supply or investor confidence remained high and they continued to hold the unlocked tokens.
Technical outlook: Will LayerZero extend its rally above $2?
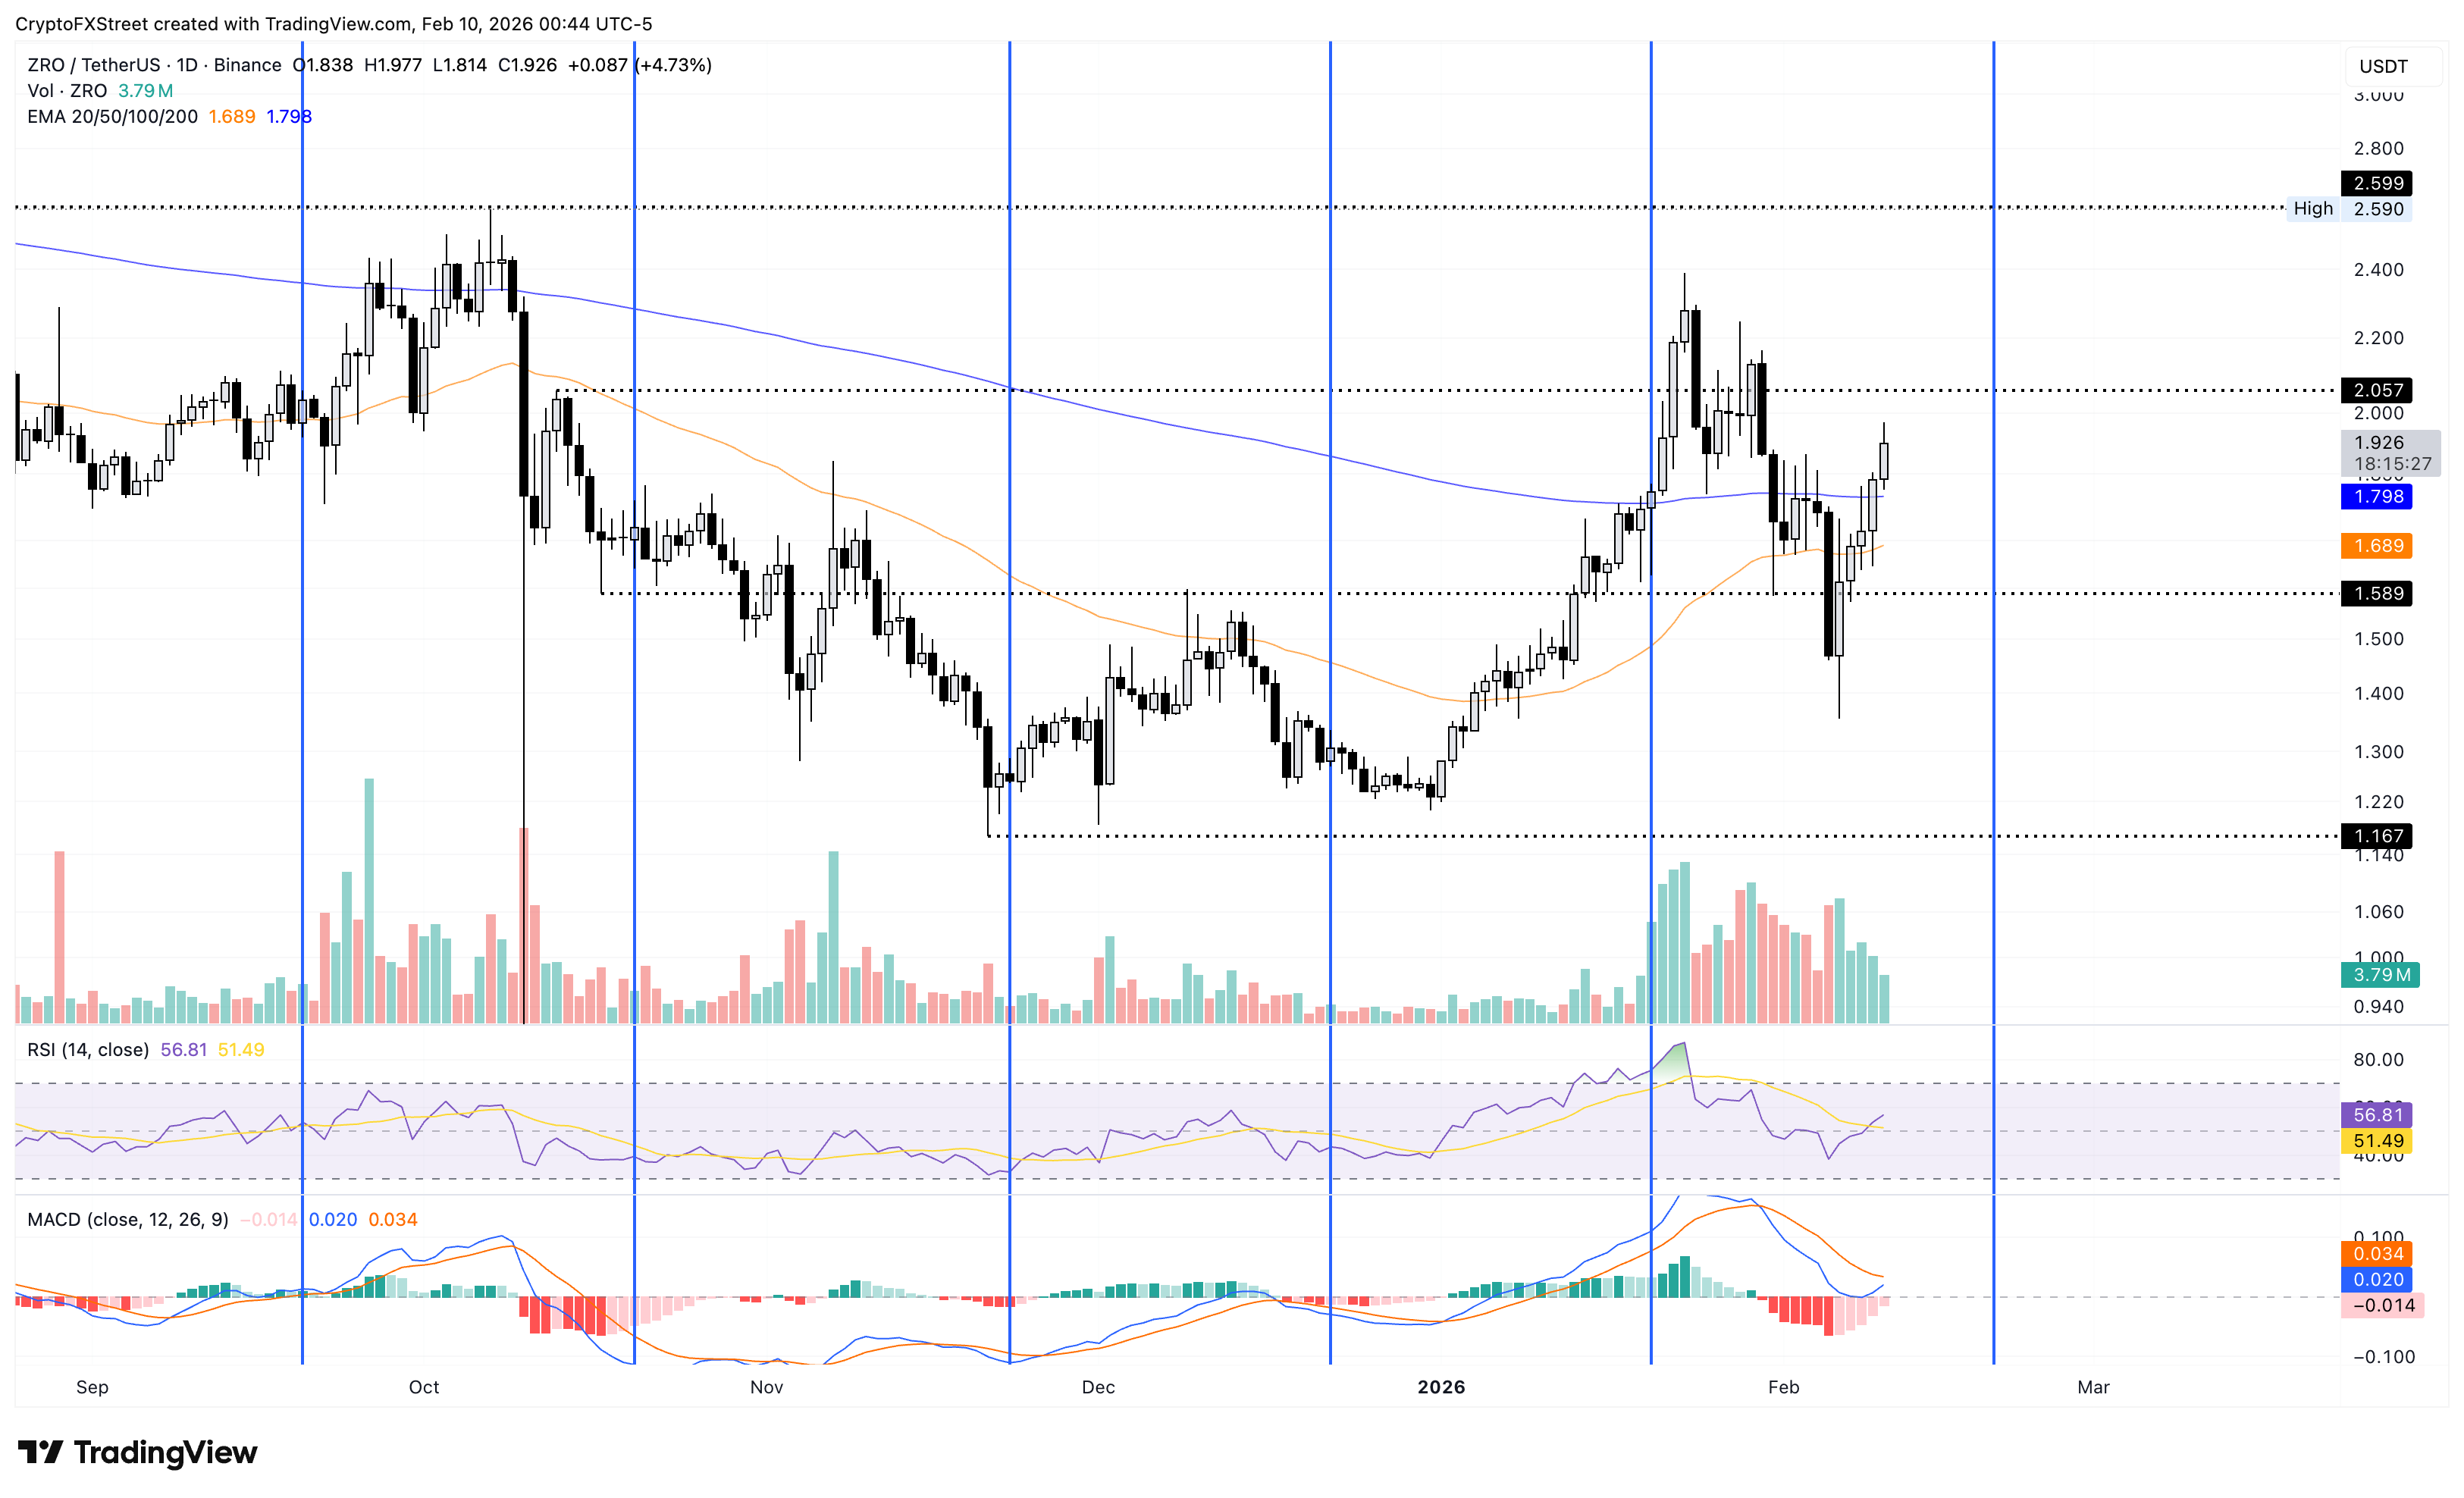
LayerZero is approaching the $2.00 psychological level with nearly 7% gains at press time on Thursday. The ZRO token is trading significantly above the 50-day and 200-day Exponential Moving Averages (EMAs) at $1.79 and $1.69, respectively, indicating a bullish bias in the short term. The upward slope in the shorter average increases the likelihood of golden crossover with the longer-term EMA.
The recovery run in ZRO token extends for the fifth consecutive day with bulls targeting the October 13 high at $2.05. A decisive close above this level could extend the rally towards the $2.39 peak from January 23.
The technical indicators on the daily chart support the bullish case. The Relative Strength Index (RSI) at 58 crosses above the midline, with further upside before reaching the overbought zone. At the same time, the Moving Average Convergence Divergence (MACD) indicator points to a bullish crossover as the histograms contract. This signals the potential for renewed bullish momentum as selling pressure wanes.
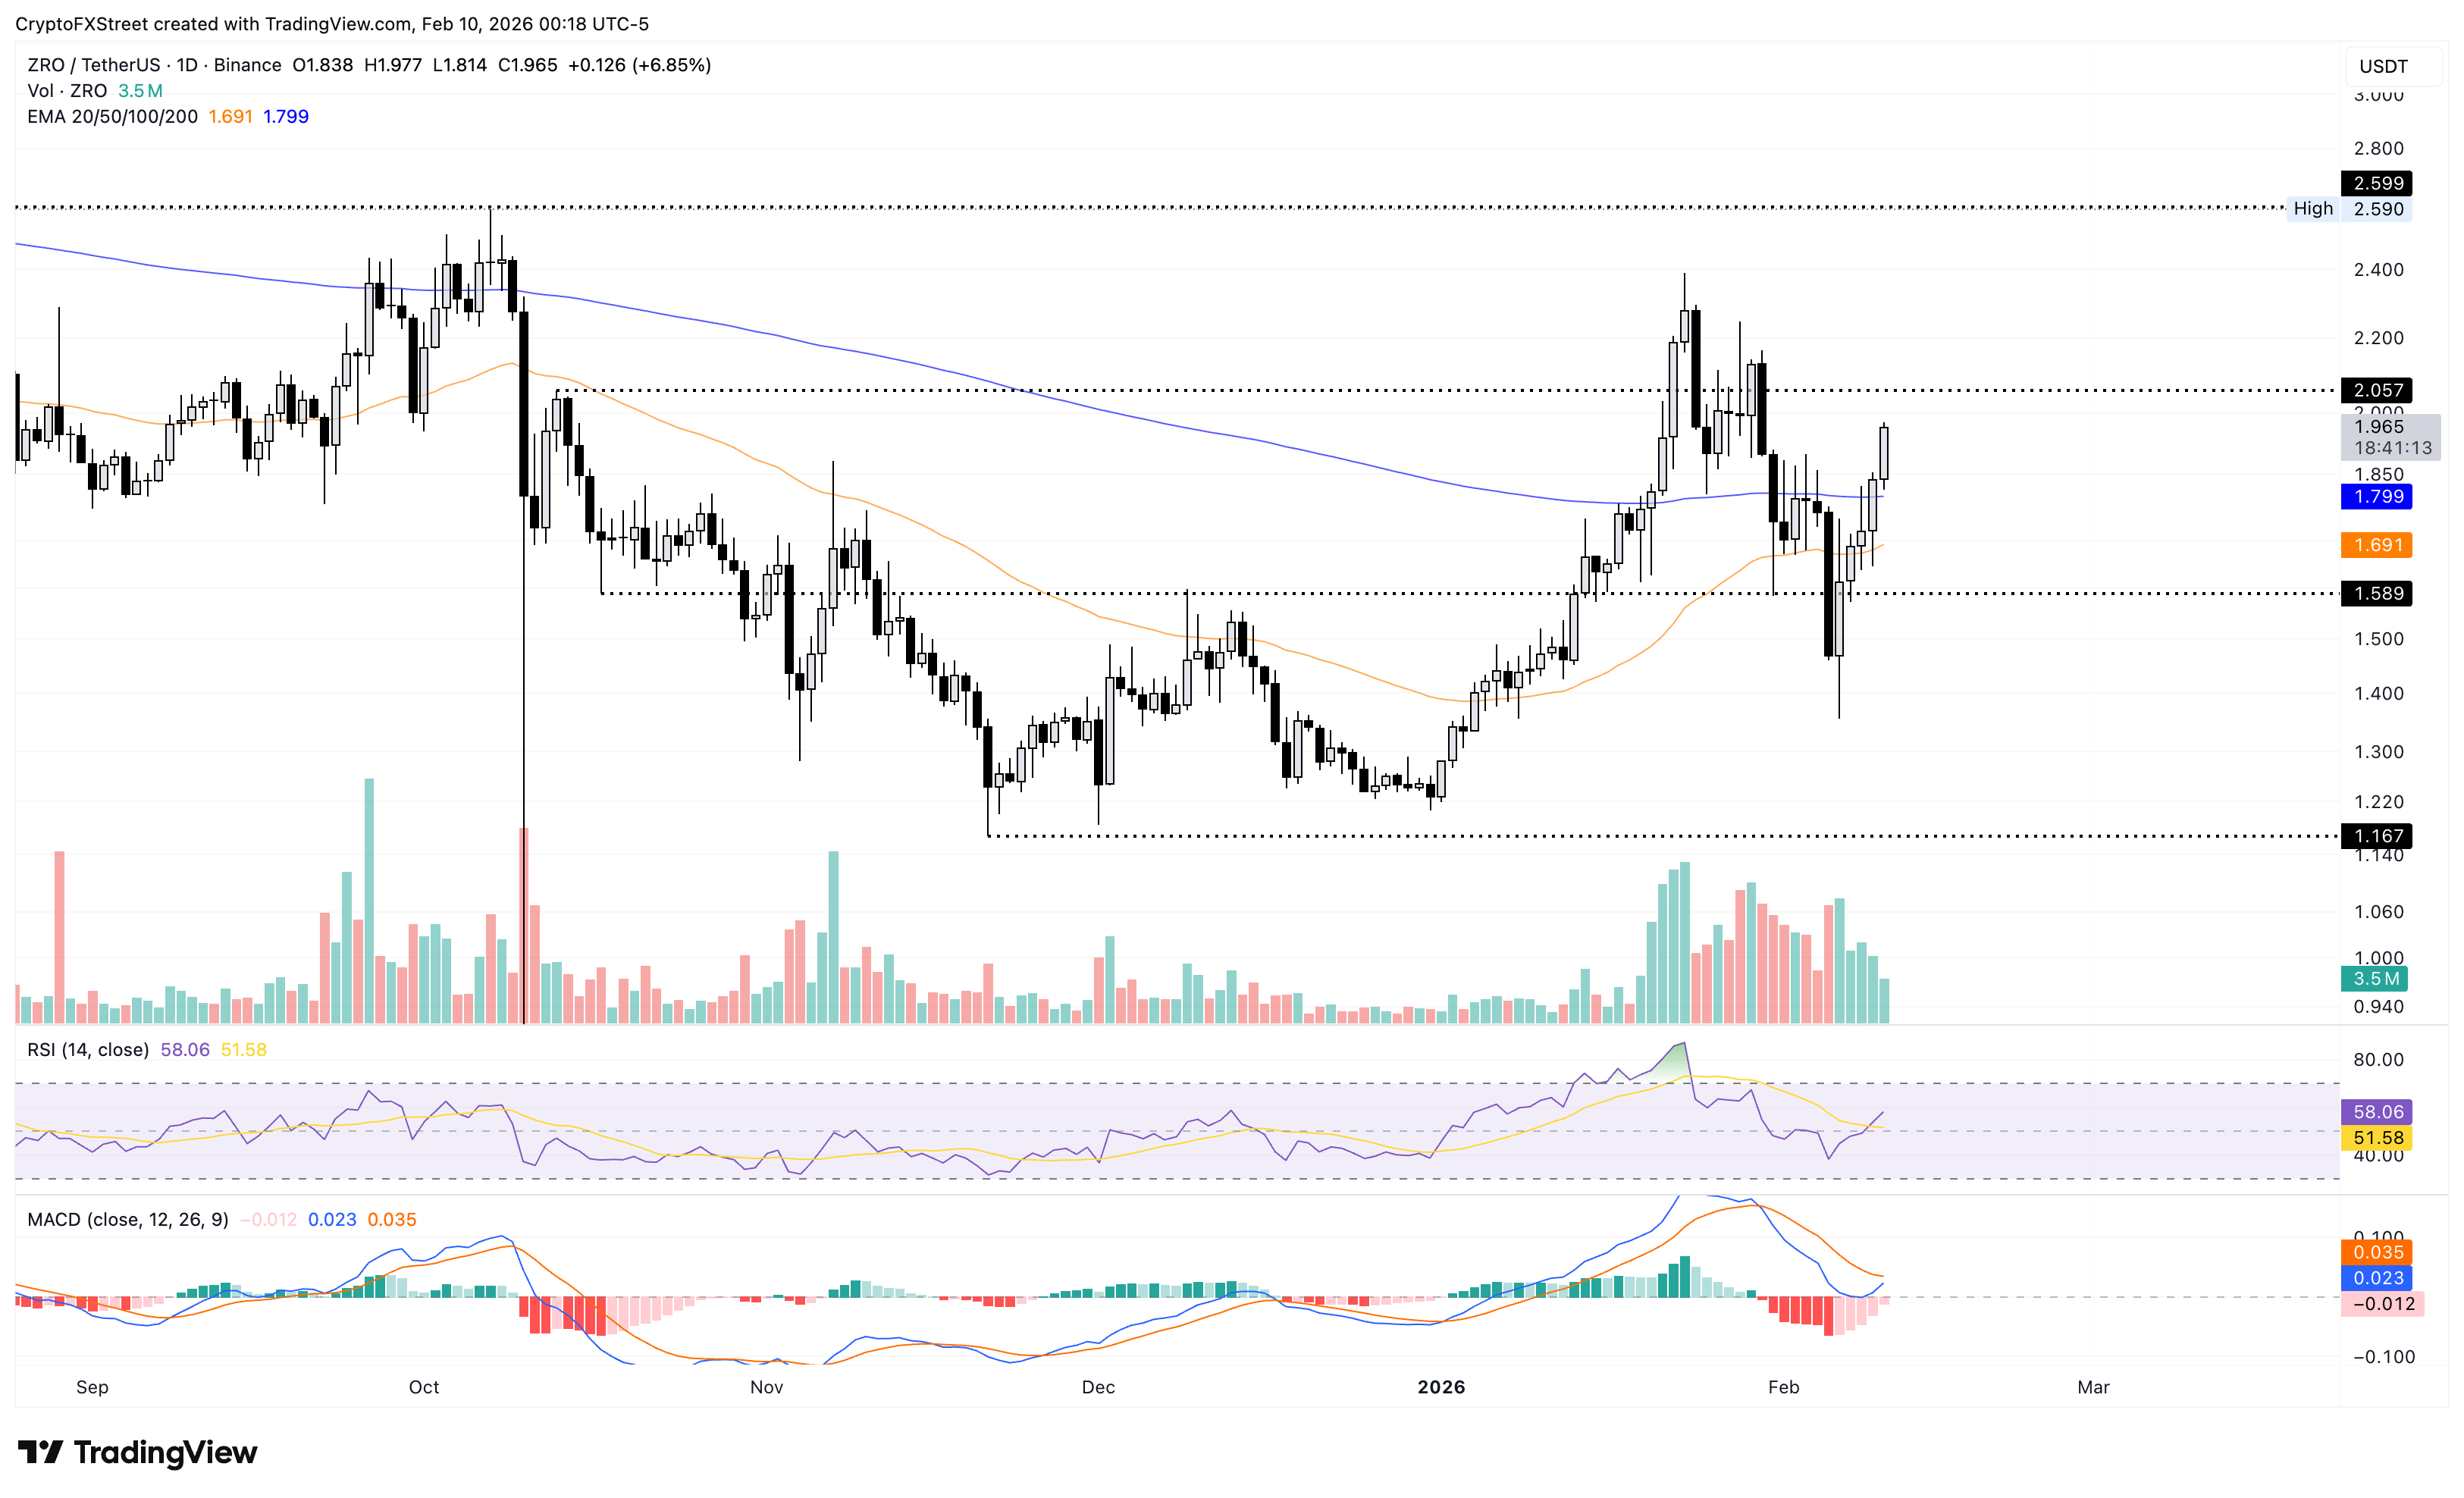
On the downside, the 200-day EMA at $1.79 could serve as the immediate support level, followed by the 50-day EMA at $1.69.
Author

Vishal Dixit
FXStreet
Vishal Dixit holds a B.Sc. in Chemistry from Wilson College but found his true calling in the world of crypto.



