Pump.fun Price Forecast: PUMP weakens amid 10 billion token unlock, low retail interest
- Pump.fun drops by nearly 2% on Tuesday, extending a reversal from a crucial resistance level that capped gains on Friday.
- Approximately 10 billion PUMP tokens will be unlocked on Tuesday, which could add downside pressure.
- Declining PUMP futures Open Interest reflects a significant drop in retail interest.

Pump.fun (PUMP) edges lower by roughly 2% at the time of writing on Tuesday, extending Monday’s 4% drop. The launchpad token remains at downside risk as 10 billion PUMP will unlock on Tuesday, while retail interest is declining. The technical outlook for PUMP indicates a bearish incline amid intense bearish momentum.
Monthly unlock and low retail interest point to downside risk
DeFiLlama data shows that 10 billion PUMP tokens will be unlocked on Tuesday in early US trading hours and distributed to community and ecosystem reserves. The release is worth over $20 million, and the community balance could add downside pressure as investors remain under pressure following last week’s intense bear market.

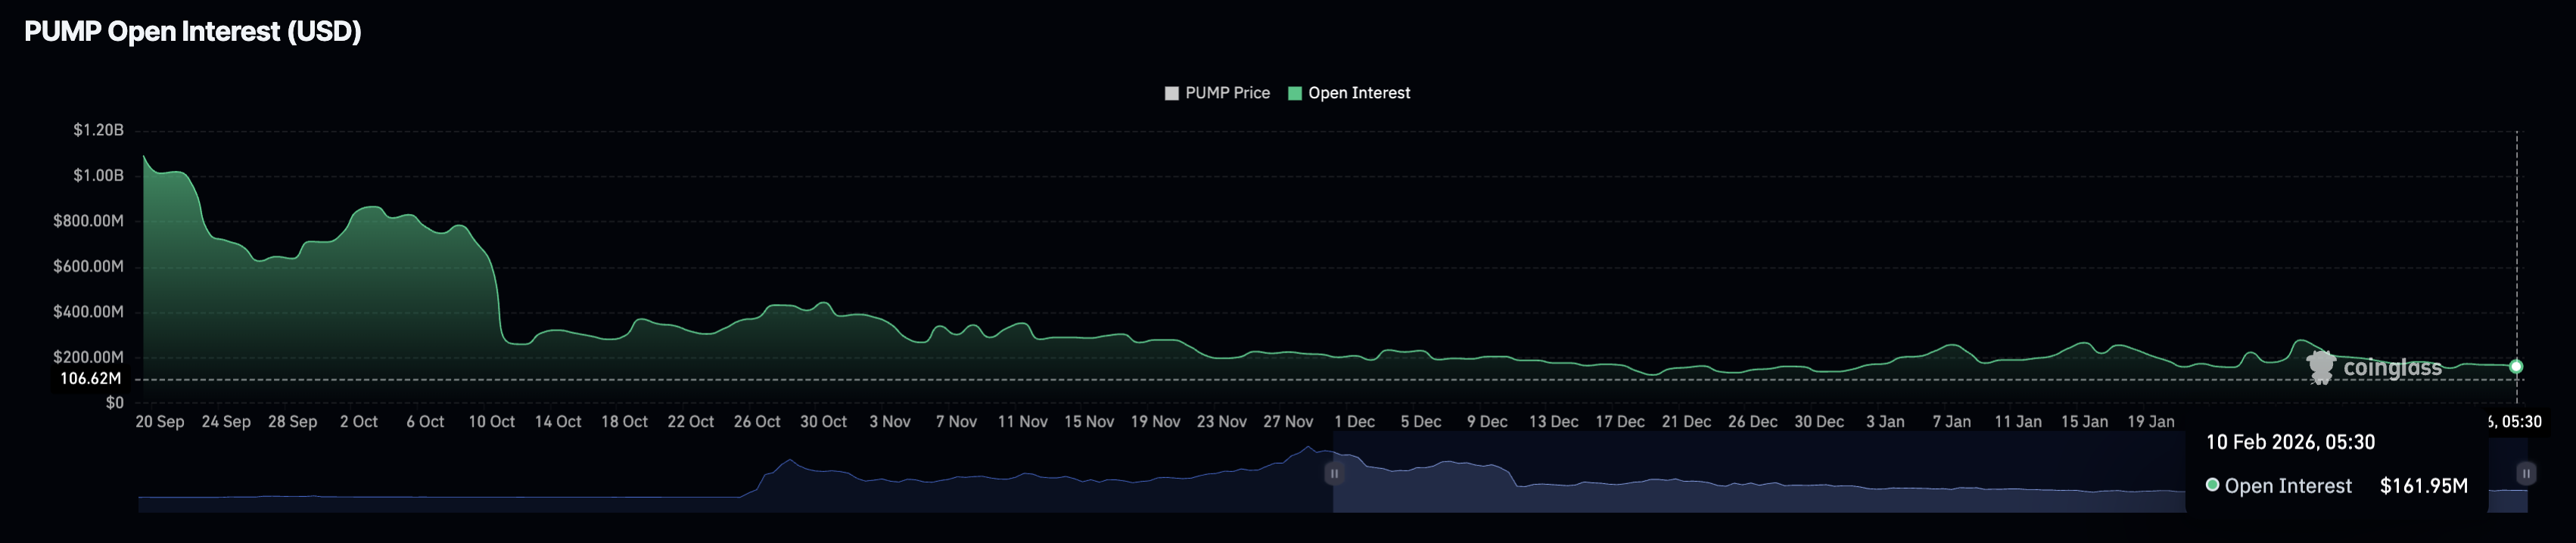
CoinGlass data shows a steady decline in PUMP futures Open Interest (OI), which fell to $161.95 million on Tuesday, underscoring reduced retail interest.
Technical outlook: Will PUMP extend its decline under pressure?
PUMP dropped below the $0.002000 psychological level after a 4% drop on Monday. At the time of writing, PUMP is down nearly 2% on Tuesday, extending the downfall for the fourth consecutive day from the February 6 high at $0.002201.
The steady decline in PUMP targets the $0.001886 support, aligning with a 4-hour candle low from February 5. A decisive close below this level on the 4-hour chart could extend the decline toward the December 29 low at $0.001775.
Technically, the indicators on the 4-hour chart reflect a bearish shift in the trend momentum. The Relative Strength Index (RSI) at 40 reverses from the halfway line, with room on the downside before reaching the oversold zone. At the same time, the Moving Average Convergence Divergence (MACD) indicator is converging with the signal line, risking a bearish crossover.
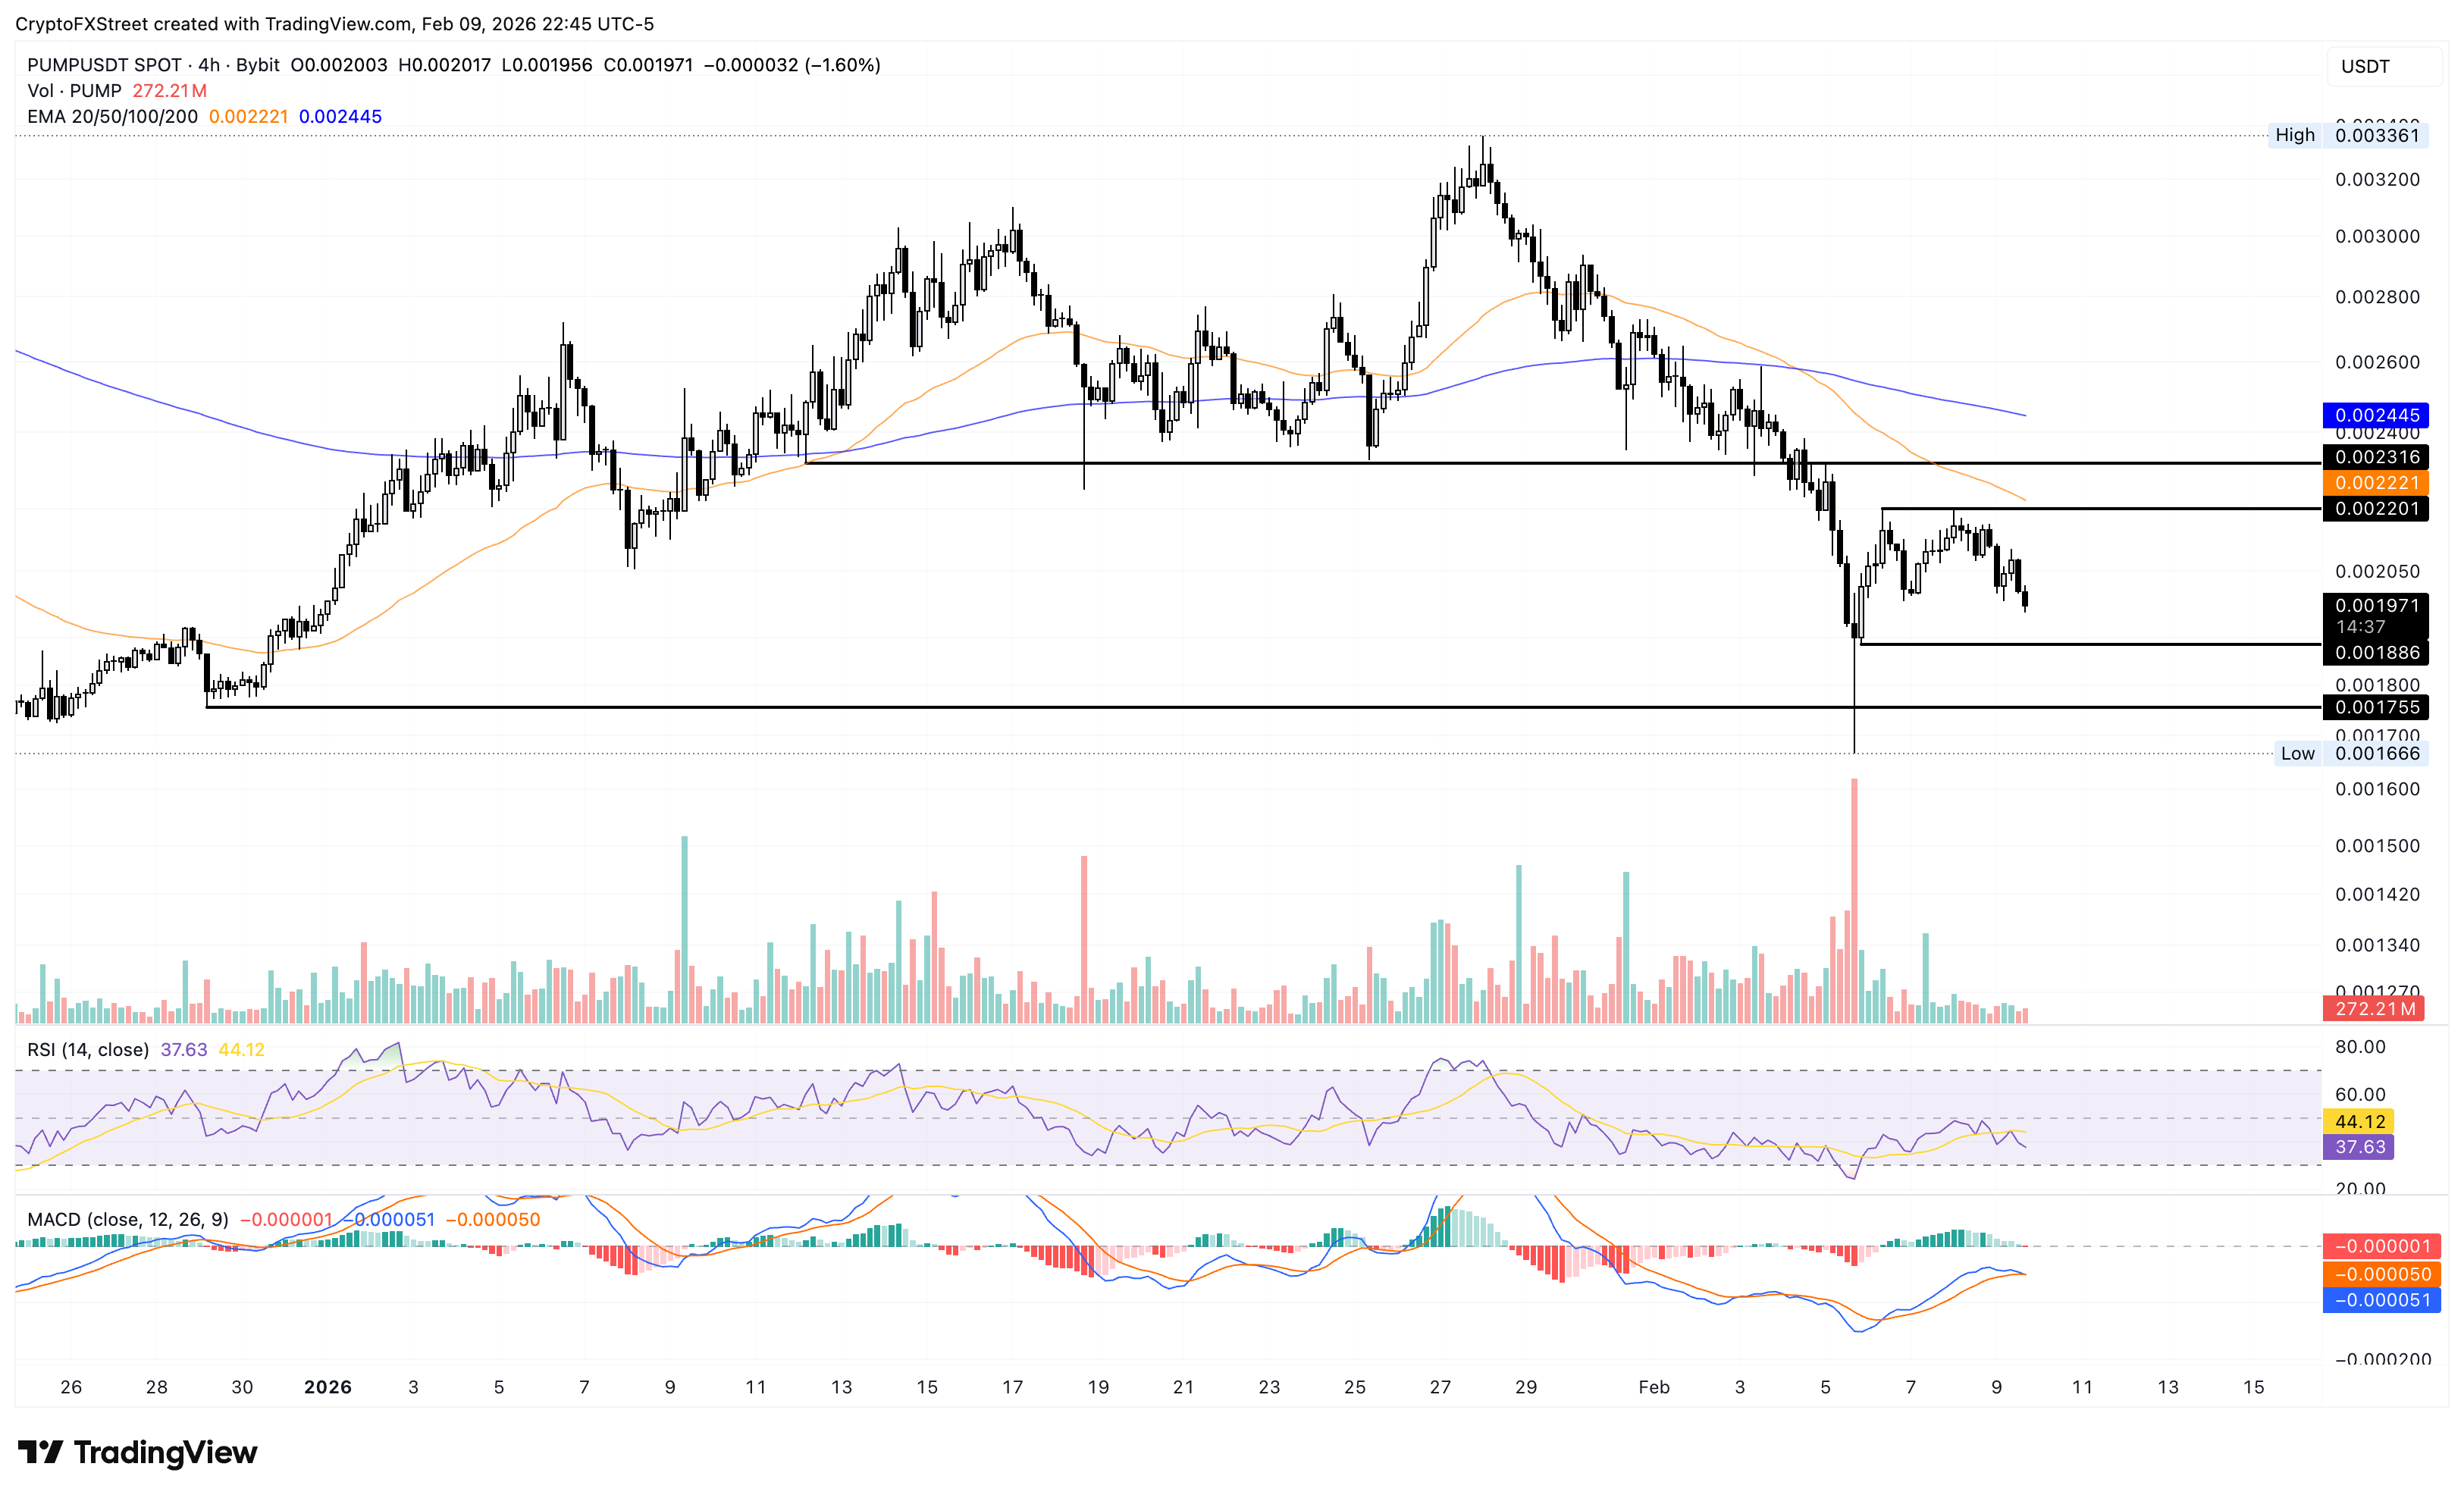
If PUMP resurfaces above the $0.002000 psychological level, it could aim for the 50-period Exponential Moving Average (EMA) at $0.002213, which is close to the February 6 high at $0.002201.
Author

Vishal Dixit
FXStreet
Vishal Dixit holds a B.Sc. in Chemistry from Wilson College but found his true calling in the world of crypto.



