|

Ethereum Elliott Wave forecast: Predicting the future path

In this technical article we’re going to take a look at the Elliott Wave charts charts of Ethereum ETHUSD published in members area of the website. As our members know, we generally favor the long side in cryptos, which have recently offered good trading opportunities. However, ETHUSD can be still correcting the cycle from the August low and is not yet ready for buying at this stage. In the following text, we will explain the Elliott Wave forecast.

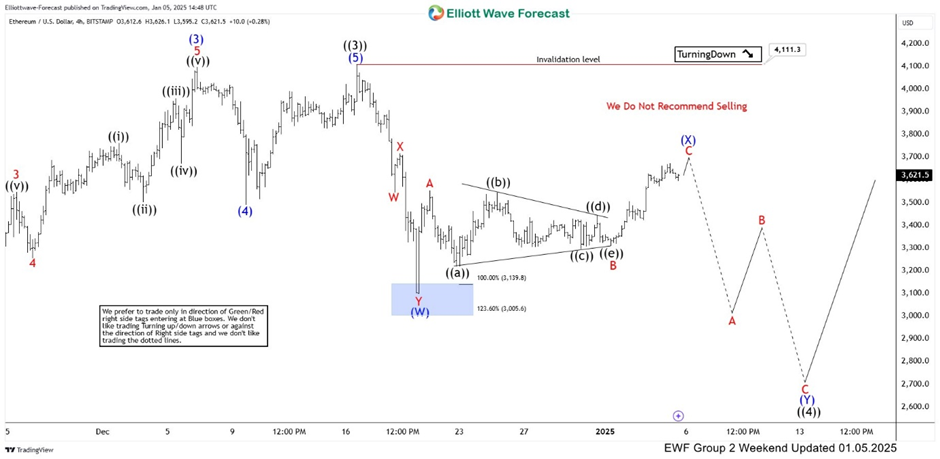
Ethereum one-hour Elliott Wave analysis 01.05.2025

Currently, ETHUSD is correcting the cycle from the 4111.3 high. The Elliott Wave view suggests that the recovery is unfolding as Zig Zag Pattern. When we analyze the lower time frames, we can observe that the inner subdivisions of waves A and B (red) exhibit 5-wave patterns, with wave B ending as a sideways triangle. The (X) connector is approaching the 0.618 Fibonacci retracement level. We believe the (X) connector should ideally end around the 3717.7-3885.1 area. We recommend that our members avoid buying at this stage.

Chart

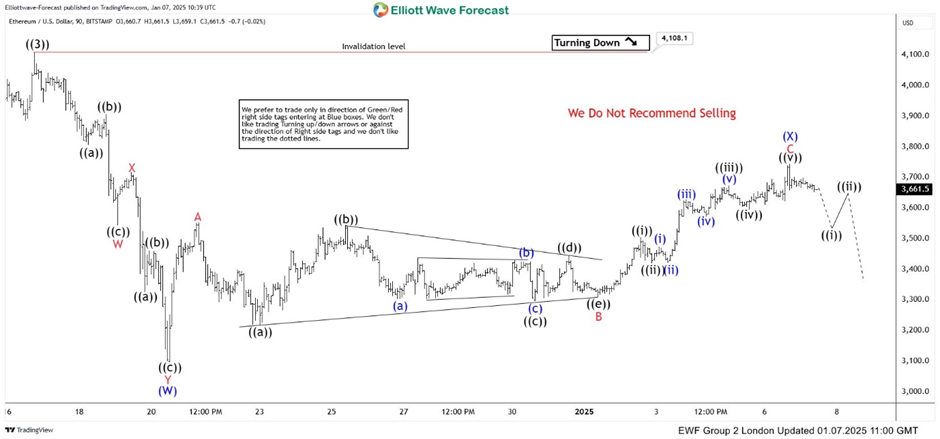
Ethereum one-hour Elliott Wave analysis 01.07.2025

The current view suggests the (X) connector may have ended at the 3477 peak. As long as the price stays below that level, we expect to see further weakness.

Chart

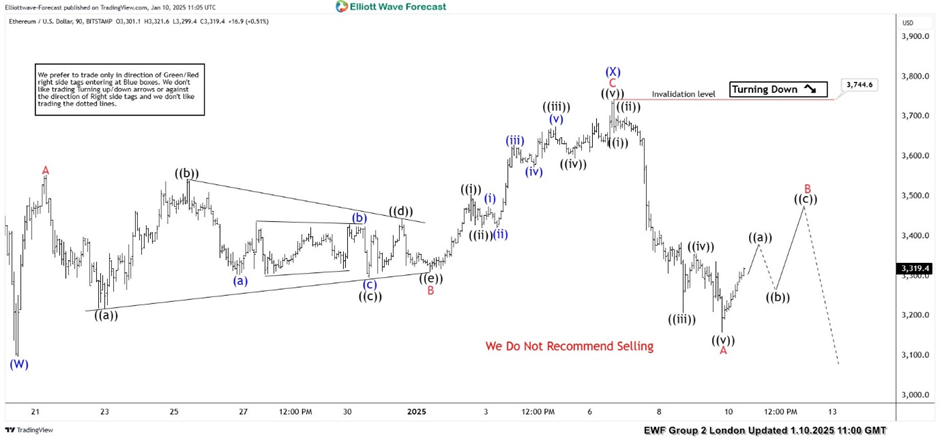
Ethereum one-hour Elliott Wave analysis 01.10.2025.

The 3744 peak held well, and we saw further separation from that high as expected. The crypto made a decent drop, forming a clear 5-wave pattern from the 3744 high. We expect to see a 3-wave bounce in red wave B before the further decline continues, ideally toward new lows. ETHUSD can target the 2713 area, as long as the pivot at the 3744 high holds. Overall, the view remains bullish. So .we don’t favor selling and would wait for an extreme zone to be reached before looking to buy again.

Chart

Elliott Wave forecast

Thank you for exploring our Ethereum (ETHUSD ) Forecast with us. While we analyze 78 instruments, it’s important to remember that not every chart represents a trading recommendation. For official trading signals, we invite you to join our Live Trading Room, where we provide actionable insights in real-time. If you’re not yet a member, take advantage of our 14-day trial to unlock new trading opportunities.

Author

Elliott Wave Forecast Team

Elliott Wave Forecast Team

ElliottWave-Forecast.com

More from Elliott Wave Forecast Team
Share:

Markets move fast. We move first.

Orange Juice Newsletter brings you expert driven insights - not headlines. Every day on your inbox.

By subscribing you agree to our Terms and conditions.

Editor's Picks

XRP edges lower despite record on-chain activity and steady ETF inflows

Ripple is trading under pressure at the time of writing on Thursday, after bulls failed to break the short-term resistance at $2.22. The reversal may extend toward Monday’s low of $1.98, especially if risk-off sentiment persists in the broader cryptocurrency market.

Aster lags recovery as perpetual DEX releases new roadmap on infrastructure, utility and ecosystem 

Aster is consolidating above $1.05 at the time of writing on Thursday, reflecting lethargic sentiment in the broader cryptocurrency market. The token native to the perpetual Decentralised Exchange had recovered from Monday's low of $0.88 but stalled around $1.08 on Wednesday.

Hyperliquid Price Forecast: Bulls aim breakout as RSI and MACD flash buy signal

Hyperliquid struggles to surface above $35 as a local resistance trendline caps the two-day recovery run. Hyperliquid Strategies Inc. (PURR) transfered 12 million HYPE tokens to Hypercore and staked 425,000 tokens, which reflects confidence. 

Cardano builds recovery momentum as sentiment improves

Cardano is extending its recovery for the second consecutive day, trading at around $0.4400 at the time of writing on Thursday. If this recovery leg from Monday's $0.3707 level steadies in the coming days, Cardano bulls could push toward a bullish December.

Orange Juice Newsletter – Smart insights by real people. Every day.

A free newsletter highlighting key market trends to help traders stay a step ahead. Daily insights on the most relevant trading topics, compiled by our experts in an easy-to-read format so you never miss an important move.

Bitcoin: BTC steadies as data suggests local bottom

Bitcoin (BTC) hovers around $91,000 at the time of writing on Friday, extending its recovery by 5% so far this week. On the institutional front, a modest outflow from US-listed spot Bitcoin Exchange Traded Funds (ETFs) marks a slowdown from previous weeks and signals a reduction in selling pressure, further supporting BTC’s recovery.