|

Ethereum Classic Chart Analysis: ETC/USD storms towards $7.20 after symmetrical triangle breakout

  • ETC/USD extends Saturday’s bounce amid fresh bid-wave.  
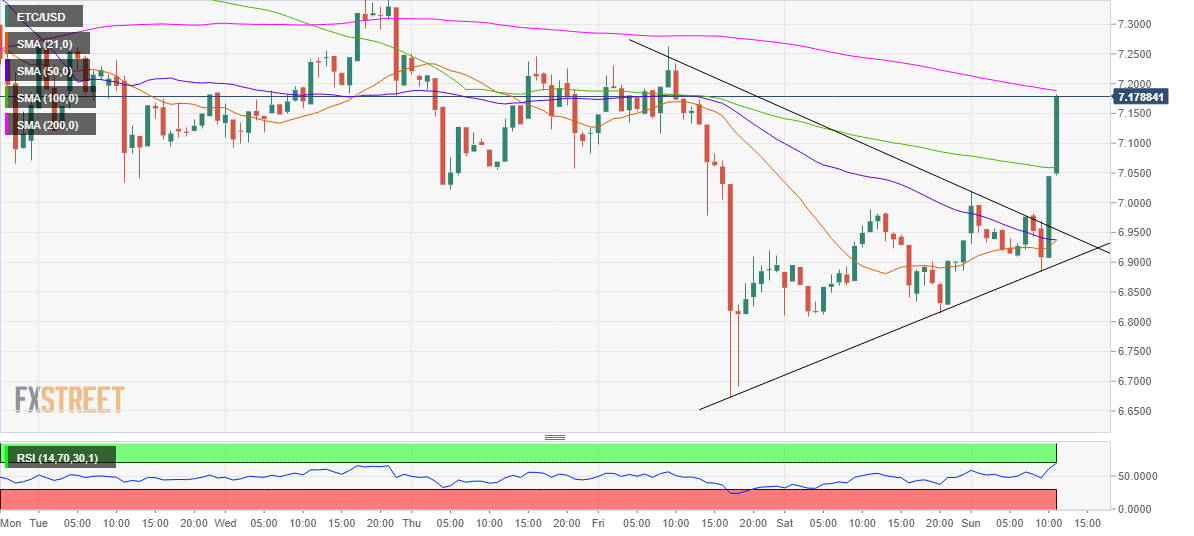
  • The coin charts symmetrical triangle breakout on hourly sticks.
  • 200-HMA offers immediate resistance after the sharp pullback.

The pullback in Ethereum Classic (ETC/USD) from $6.8844 appears to have gathered steam this Sunday, as the coin sees a rapid rise to the intraday highs above $7.15.

The price picked-up bids right after the bulls took out the powerful resistance at $6.93, the convergence of the 21 and 50-hourly Simple Moving Averages (HMAs).

The sharp rally, however, came on the back of the symmetrical triangle breakout on the hourly chart above the key resistance at $6.9606. 

The hourly Relative Strength Index (RSI) spiked towards the overbought region, now trading near 69.0.

On its relentless rise, the ETC bulls ripped through the bearish 100-HMA at $7.0586. The further upside now remains capped by the horizontal 200-HMA at $7.1885.

A break above which the $7.20 level will be tested. The August 7 high of $7.2618 could be next on the buyers’ radar.

If the bulls face rejection at the 200-HMA barrier, the price could drop back towards the resistance-turned-support at 100-HMA.

The next support is aligned at the falling trendline (pattern) resistance now support at $6.9548.

ETC/USD: Hourly chart

fxsoriginal

ETC/USD: Additional levels to consider

ETC/USD

Overview
Today last price7.1358
Today Daily Change0.1991
Today Daily Change %2.87
Today daily open6.9367
 
Trends
Daily SMA206.9282
Daily SMA506.432
Daily SMA1006.5635
Daily SMA2007.0456
 
Levels
Previous Daily High6.9882
Previous Daily Low6.8092
Previous Weekly High8.295
Previous Weekly Low6.4967
Previous Monthly High7.5745
Previous Monthly Low5.5346
Daily Fibonacci 38.2%6.9198
Daily Fibonacci 61.8%6.8776
Daily Pivot Point S16.8345
Daily Pivot Point S26.7324
Daily Pivot Point S36.6555
Daily Pivot Point R17.0135
Daily Pivot Point R27.0904
Daily Pivot Point R37.1925

Author

Dhwani Mehta

Dhwani Mehta

FXStreet

Residing in Mumbai (India), Dhwani is a Senior Analyst and Manager of the Asian session at FXStreet. She has over 10 years of experience in analyzing and covering the global financial markets, with specialization in Forex and commodities markets.

More from Dhwani Mehta
Share:

Editor's Picks

Ripple slumps toward $1.00 despite network growth and ETF demand

Ripple (XRP) is holding above the key $1.00 psychological support level at the time of writing on Tuesday, even as the market endures a protracted downturn that began in mid-June.

Crypto Today: Bitcoin, Ethereum, XRP correction deepens as capitulation persists

The cryptocurrency market continues to face downward momentum on Tuesday, with Bitcoin (BTC) sliding below $60,000, Ethereum (ETH) breaching the $1,600 mark, and Ripple (XRP) retreating toward its critical $1.00 psychological threshold.

Why a hawkish Bank of Japan could trigger the next Bitcoin sell-off

The Japanese Yen (JPY) recorded its lowest level in four decades, at 162.00 against the US Dollar (USD) on Tuesday, raising concerns that the Bank of Japan (BoJ) could intervene to protect the Yen.

Bitcoin struggles near $59,500 amid persistent ETF outflows, US-Iran Doha talks in doubt

Bitcoin struggles around $59,500 on Tuesday after a massive two-week correction. Investors remain cautious as the US and Iran offer different signals over whether their delegations will hold direct peace talks in Qatar.

Bitcoin: BTC hits 20-month low, will the pain continue?

Bitcoin has remained under pressure this past week, losing over 5% as traders assess mixed signals from different parties involved in the Middle East conflict.