ETH/USD bearish decline starts ABCDE triangle pattern within uptrend
-
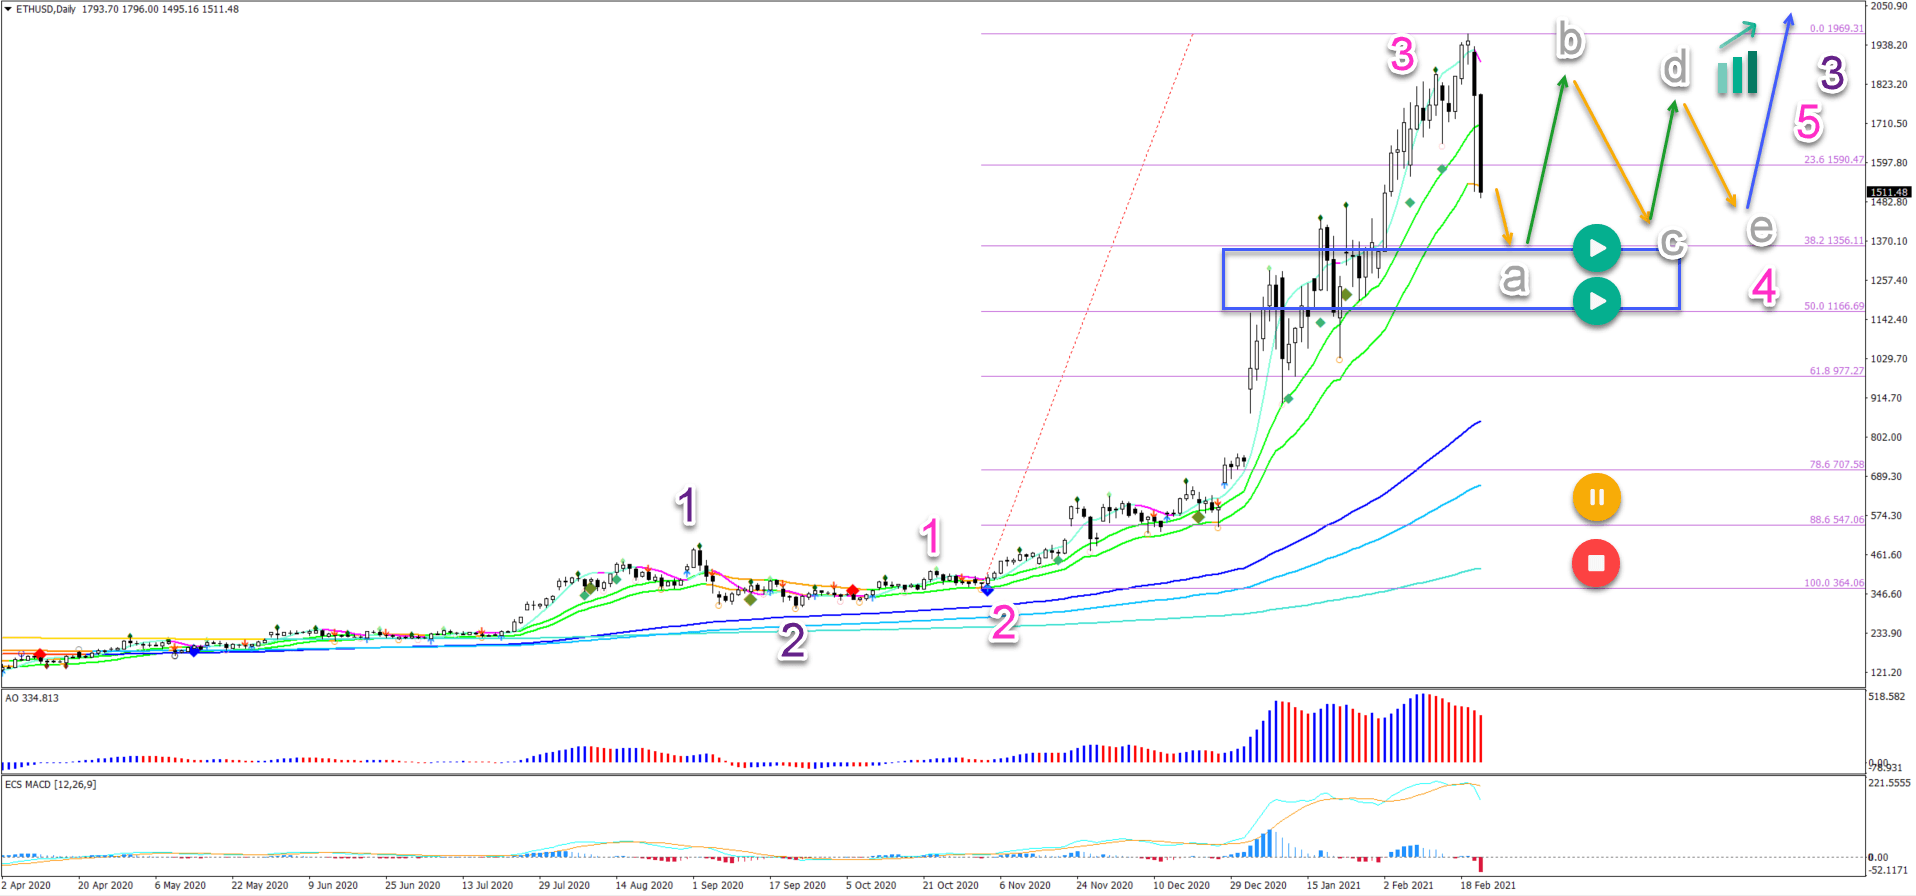
Ethereum (ETH/USD) is in a strong uptrend. The bullish momentum is similar or even stronger than Bitcoin’s recent surge above $50k.
-
The ETH/USD recent surge up has been strong. Price moved from $400-$500 to the $2,000 resistance level in just 3 months.
-
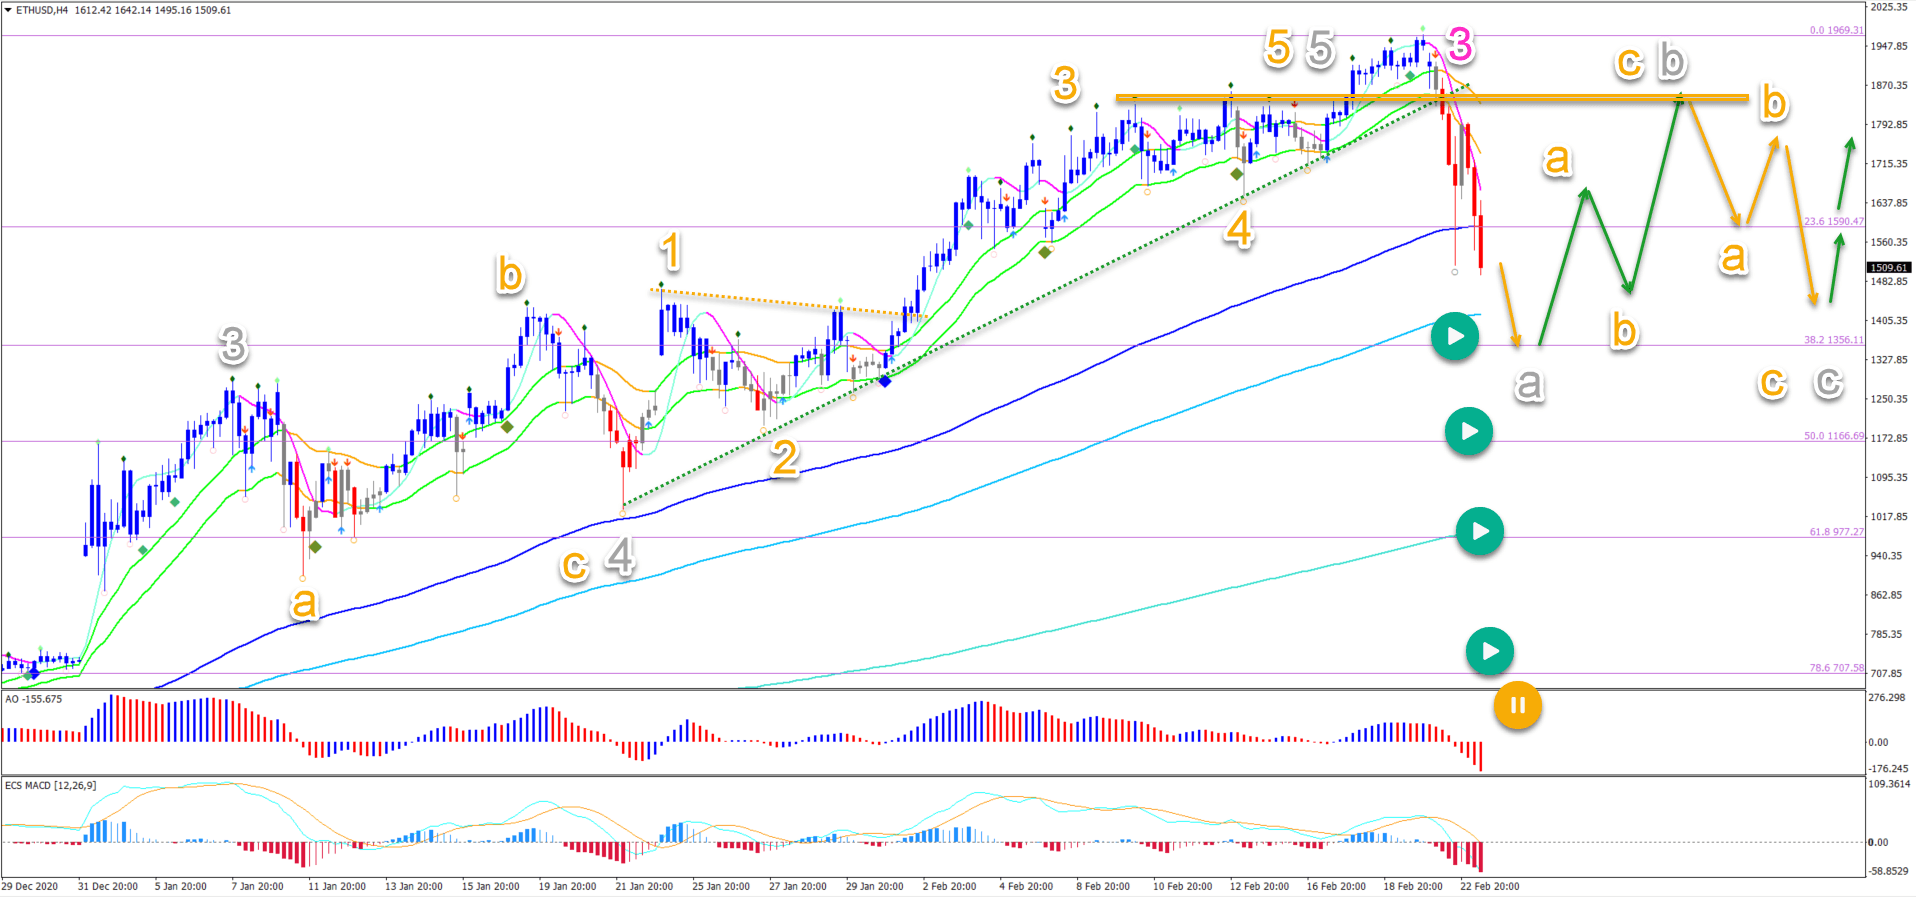
On the 4 hour chart, we can see that the ETH/USD bullish momentum is temporarily over. Price has broken below the support trend line (dotted green) and the 21 ema zone.

But strong bearish candlesticks are now visible on the 4 hour chart… Will this bearish volatility change the outlook? Let’s review the key wave and chart patterns.
Price charts and technical analysis
The ETH/USD recent surge up has been strong. Price moved from $400-$500 to the $2,000 resistance level in just 3 months.
Now bearish pressure seems to be actively pushing price action lower again. Is this a reversal or just a retracement?
-
In our view, the probability of a retracement is much higher than a reversal. Why? Because the recent push up is a typical wave 3 (pink).
-
This means that the current pullback is probably a wave 4 (pink).
-
Waves 4 are usually choppy, corrective, and shallow retracements. The 23.6% Fibonacci level already acted as support but price action broke below it.
-
The next support zone is the 38.2% Fib or 50% Fibonacci levels. These Fibs are expected to act as support and should create some bounce to the upside.
-
The key pattern to look for is an ABCDE triangle pattern. If this chart pattern emerges, then it indicates the end of the retracement. That should give a green light to the uptrend to continue for a new higher high.
After the price action completes 5 waves (grey) in wave 4 (pink), the uptrend should break the pattern and move north (blue arrow). Only a very deep correction puts the uptrend in doubt (orange and red circles).
On the 4 hour chart, we can see that the ETH/USD bullish momentum is temporarily over. Price has broken below the support trend line (dotted green) and the 21 ema zone.
Price action should be able to reach the 38.2% Fibonacci level where support support is expected. If a triangle pattern does emerge, then there should be multiple ABC patterns visible in each leg.
The analysis has been done with the ecs.SWAT method and ebook.
Author

Chris Svorcik
FS method
Chris Svorcik is a trader, analyst, and educator with over 15 years of experience in financial markets, specializing in moving averages, market structure, and price patterns.


