Dow theory: How a century-old analytical tool helps predict crypto prices

Dow theory is a framework that helps traders identify price trends and find the best moments to buy and sell their assets. The theory is more than one hundred years old, but today’s crypto investors find it a good tool to predict price movements and develop weighted trading strategies. Let’s see what the Dow theory is and how you can use it to maximize your trading profits.
Dow theory and the American stock market
In 1889, an American journalist Charles Henry Dow founded the Wall Street Journal. During the next decade, he used the magazine to publish his market analysis editorials. A few years after his death, his colleagues organized the notes and presented them as the Dow theory — one of the first data-driven models of market behavior.
The theory was developed in the 20th century, when the American industry was on the rise, and Dow wanted to find a concise way to describe market movements. He created two indices: DJIA, or Dow Jones Industrial Average (some America’s biggest manufacturing companies), and DJTA (Dow Jones Transportation Average — the largest railroads, airlines, trucking, delivery, and shipping businesses).
The performance of DJIA and DJTA is used in the Dow theory to predict market trends: if both indices grow synchronously, the trend is likely to continue; if they cross, we may expect the reversal of the trend. Although DJIA is over a century old, it still reflects the overall state of the American economy.
How can we apply a stock price theory to the crypto market?
Today’s cryptocurrency industry is as young as the stock market at the end of the 20th century. This is the reason why cryptocurrencies have the same traits as stocks back then: they are volatile, hard to predict, and lack regulation.
There are many high-tech market analysis methods today, but just like a century ago, markets are driven by human psychology. With a certain degree of adaptation, we can use the original Dow theory assumptions to analyze the cryptocurrency market.
Principles of Dow theory
There are 6 basic principles, or tenets, in the Dow theory. Let’s take a look at each of them.
First Principle, there are 3 types of market trends based on their duration
Market movements in the Dow theory are divided into three groups based on how long and influential they are:
-
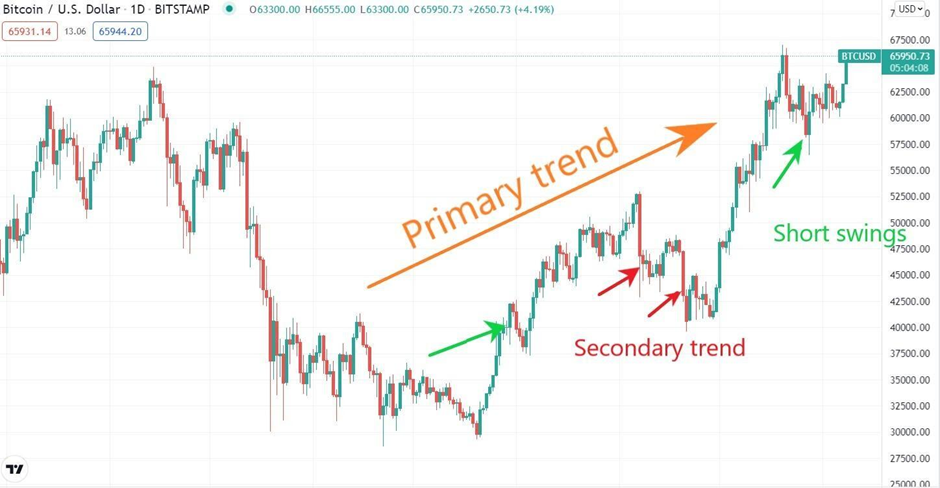
A primary trend is the longest and the most influential one — it lasts for 1 year or more. A trader’s portfolio should be aligned with this trend: while it’s in place, savings bring the best profit.
-
A secondary trend lasts between 10 days and 3 months. It moves in the opposite direction from the primary one and can slash up to 1-2 thirds of its value gain.
-
Short swings last from hours to 2-3 weeks, and they are directed opposite from the secondary trend.
Here is a BTC/USD chart illustrating a bullish primary trend with secondary movements and short wings:
Source: TradingView
Second Principle, a trend comprises 3 phases
In a long primary trend, three phases reflect traders’ activity.
-
Accumulation. At the very beginning of a trend, seasoned investors realize that the asset is undervalued and start buying it. Low prices at this point may have been set by the preceding bearish trend.
-
Public participation. The trend is reinforced as more and more traders spot it and start buying the asset. This is the longest phase, but traders that join here earn less than those who did so at the accumulation stage.
-
Distribution. The earliest investors understand that the trend will end soon and start selling what they have bought. The trend reverses as they exit the market.
Third Principle, stock prices reflect news
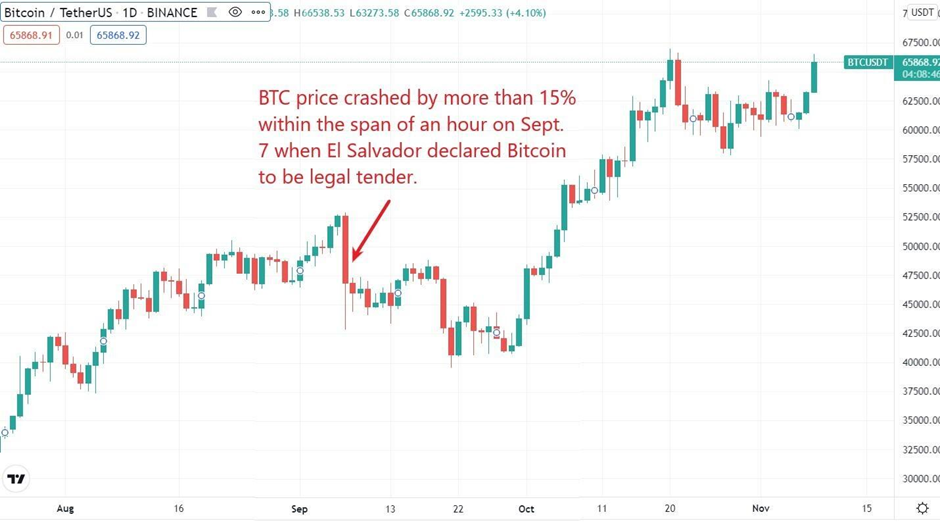
Asset prices react to the news very quickly. They almost instantly reflect all the information, fears, and expectations that come with the news events. And here, the objective significance of the news is not what matters — rather, it’s the emotional response provoked by the news event and its intensity.
The value of cryptocurrency is to a high extent based on reputation, and that’s why positive and negative publications make it so volatile. In the picture below, you can see how the BTC price reacted to the news that El Salvador was to make Bitcoin legal tender. An immediate response was negative, but the subsequent movement quickly reversed:
Source: TradingView
Fourth Principle, indices must confirm trends
In the original Dow theory, the largest companies’ stocks price predictions were made by analyzing the dynamic of Dow Jones Transportation and Industry Averages (DJTA and DJIA). Usually, they tended to go in the same direction, but sometimes they were starting to move apart, which was the sign that the market trend would reverse.
For cryptocurrencies, there are some indices for technical analysis, too. For instance, S&P has recently started tracking different cryptos to demonstrate performance benchmarks for the largest assets. The currencies picked by S&P are listed on major crypto exchanges and meet the liquidity and market cap criteria.
Fifth Principle, trading volume must confirm trends
If the primary trend is upward, it should correlate with the increased trading volume. During the Public Participation phase described in the second Dow theory principle, many investors join the market thus pointing to a steadily growing interest in an asset. In the case of a decreasing trading volume, the market activity is weak, which may indicate that a downward trend is about to begin.
Sixth Principle, with no signs of a reversal, the trend should continue
Until there are clear signs of a reversal, a trader can assume that the trend is to continue, so it’s worth keeping their positions. A decreasing trading volume or crossing indices may be the signal that the reversal is near.
On the chart below, you can see how the trading volume outbreaks constantly occur amid an upward trend thus confirming its stability:
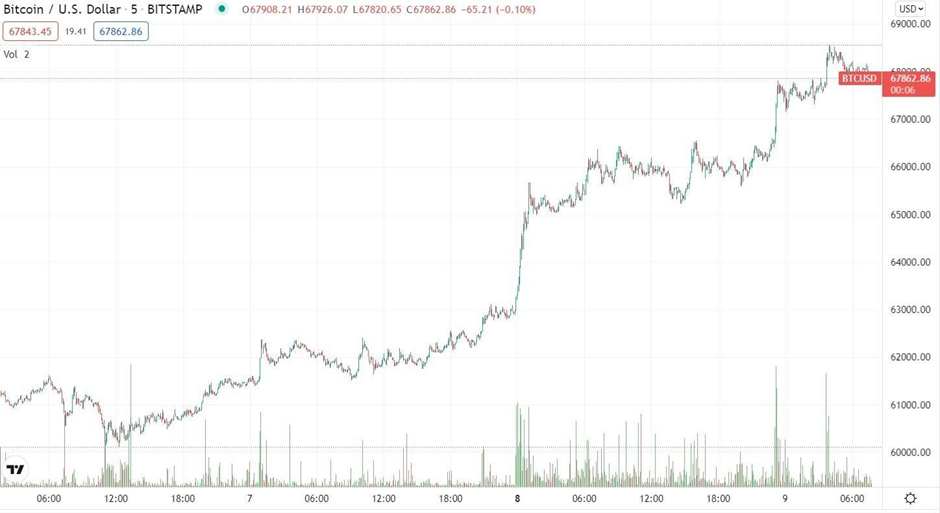
Source: TradingView
Using Dow theory principles in trading
Together, 6 tenets of the Dow theory form a framework that allows investors to organize information in the crypto market, define the beginning of bearish and bullish trends, and decide when to buy and sell digital coins.
To pick the best entry point, make sure the upward trend is in the accumulation or distribution phase and is reaffirmed by an increased trading volume or correlated indices.
Once you’ve confirmed the trend, it is recommended to stick to it and make trades within it. Remember that secondary bearish trends can eat up to ⅔ of the primary trend gains, so it’s worth holding off on new trades until the bearish movement ends.
Bottom line
Despite being over one hundred years old, the Dow theory remains one of the basic technical analysis tools in cryptocurrency. To make more weighted decisions, investors combine it with such analytical tools as MACD or moving average. Grouping correlated assets like BTC and ETH and watching their price movements also helps understand the market better. The general rule here is simple: the more factors support the decision to buy or to sell, the better is the chance that you’re considering the right step to take.
Author

Mike Ermolaev
Independent Analyst
Mike Ermolaev is the founder of Outset PR. The agency helps tech companies, especially blockchain and Web3 projects, get the desired recognition thanks to its wealth of media connections.


![Hyperliquid representatives, Trade[XYZ] meet SEC Crypto Task Force to discuss digital asset regulation](https://editorial.fxsstatic.com/images/i/Hyperliquid_Bull.png)
