Crypto.com Price Analysis: CRO facing a multiple-month correction despite 500% YTD returns
- CRO price had a 728% increase since the low of March, and 500% YTD returns.
- The crypto card pioneer is finally slowing down and could be at risk of a multiple-month correction.

Crypto.com had one of the best years in the cryptocurrency industry, establishing itself as a top 10 coin by market capitalization and outperforming the rest. CRO price peaked at $0.191 in August, its all-time high, and it's currently trading at $0.169 after a brief correction period.
The marketing behind Crypto.com's digital asset has been immensely efficient. After several positive announcements and promotions, the value of CRO exploded, but not everyone is convinced. Vishal Shah, the founder of Alpha5, stated:
In effect, it’s throwing the kitchen sink in to try and drive a higher value for the token.
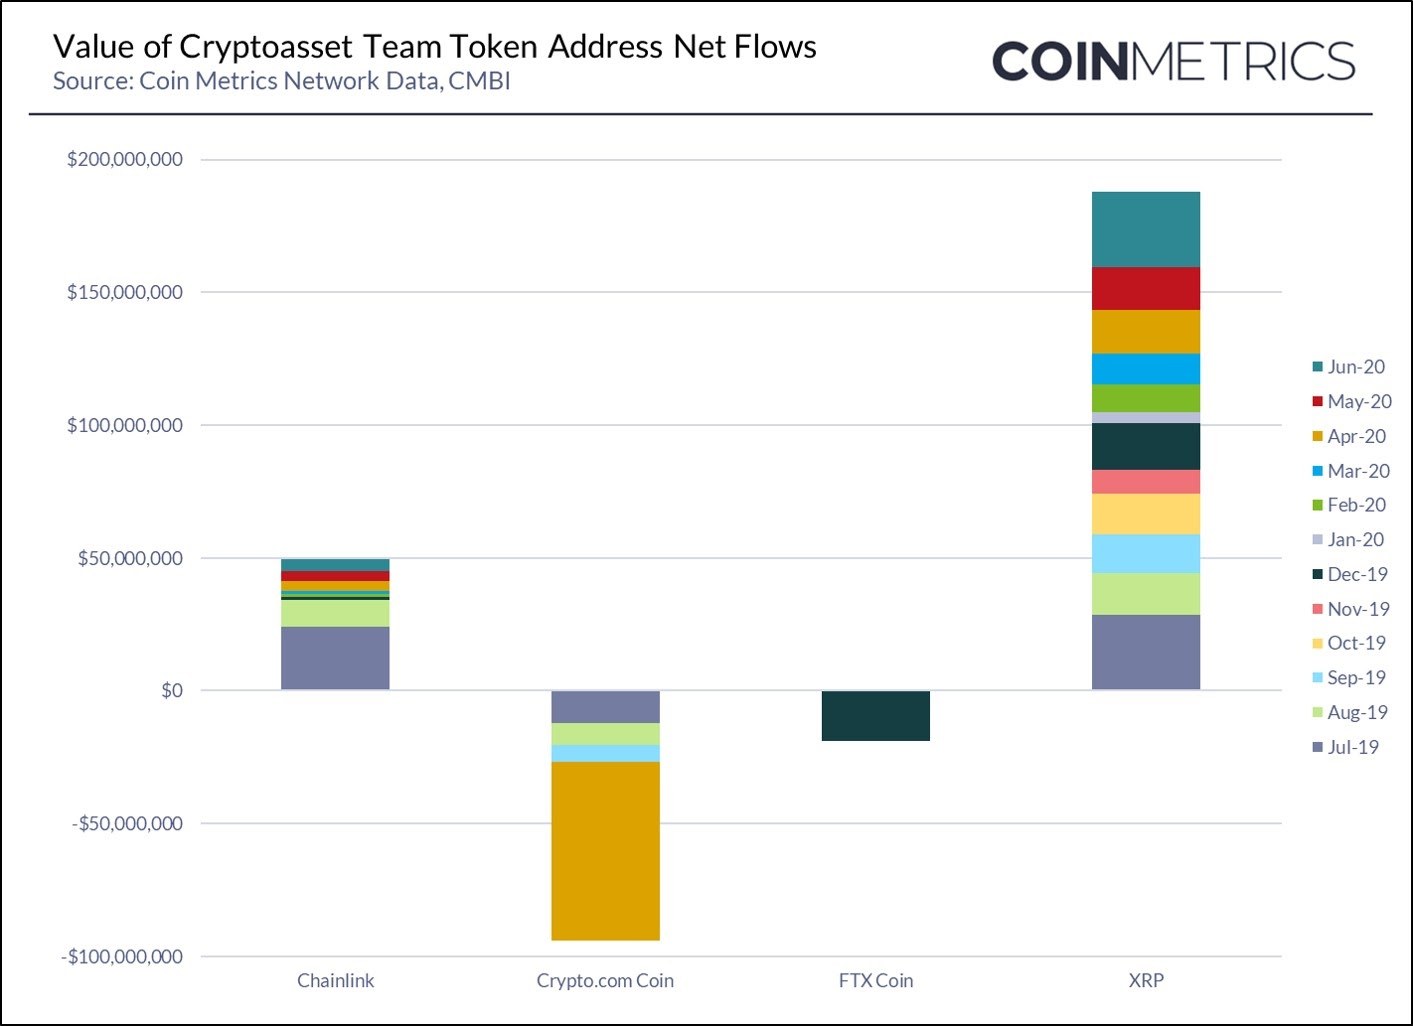
According to the most recent statistics provided by CoinMetrics, Crypto.com’s team addresses were the most active in the past year.
It is worth noting though that the largest team address activity during Q2 was the credit of $67M CRO to Crypto.com Coin team addresses, without which the net value of cryptoassets that moved outside of Company Team controlled addresses would have been $76.5M.
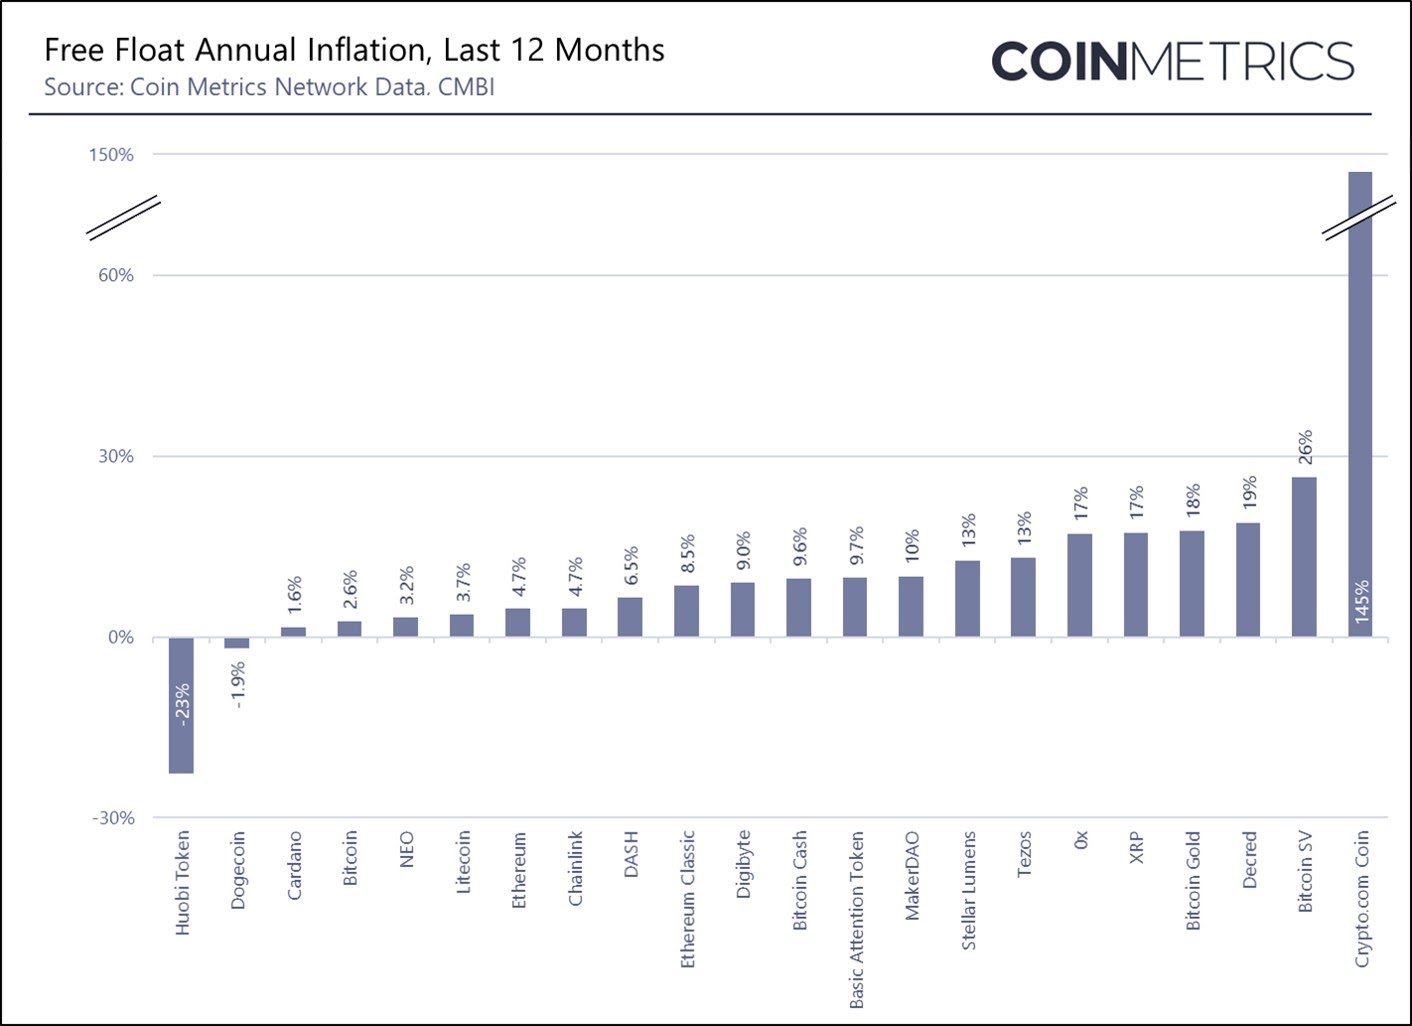
CRO Inflation Chart
This means that CRO founding members have been selling their tokens as prices surged, creating a significant boost in the token's inflation levels. Crypto.com had the highest Free Float Annual Inflation rate in the past 12 months.
CRO/USD Monthly chart
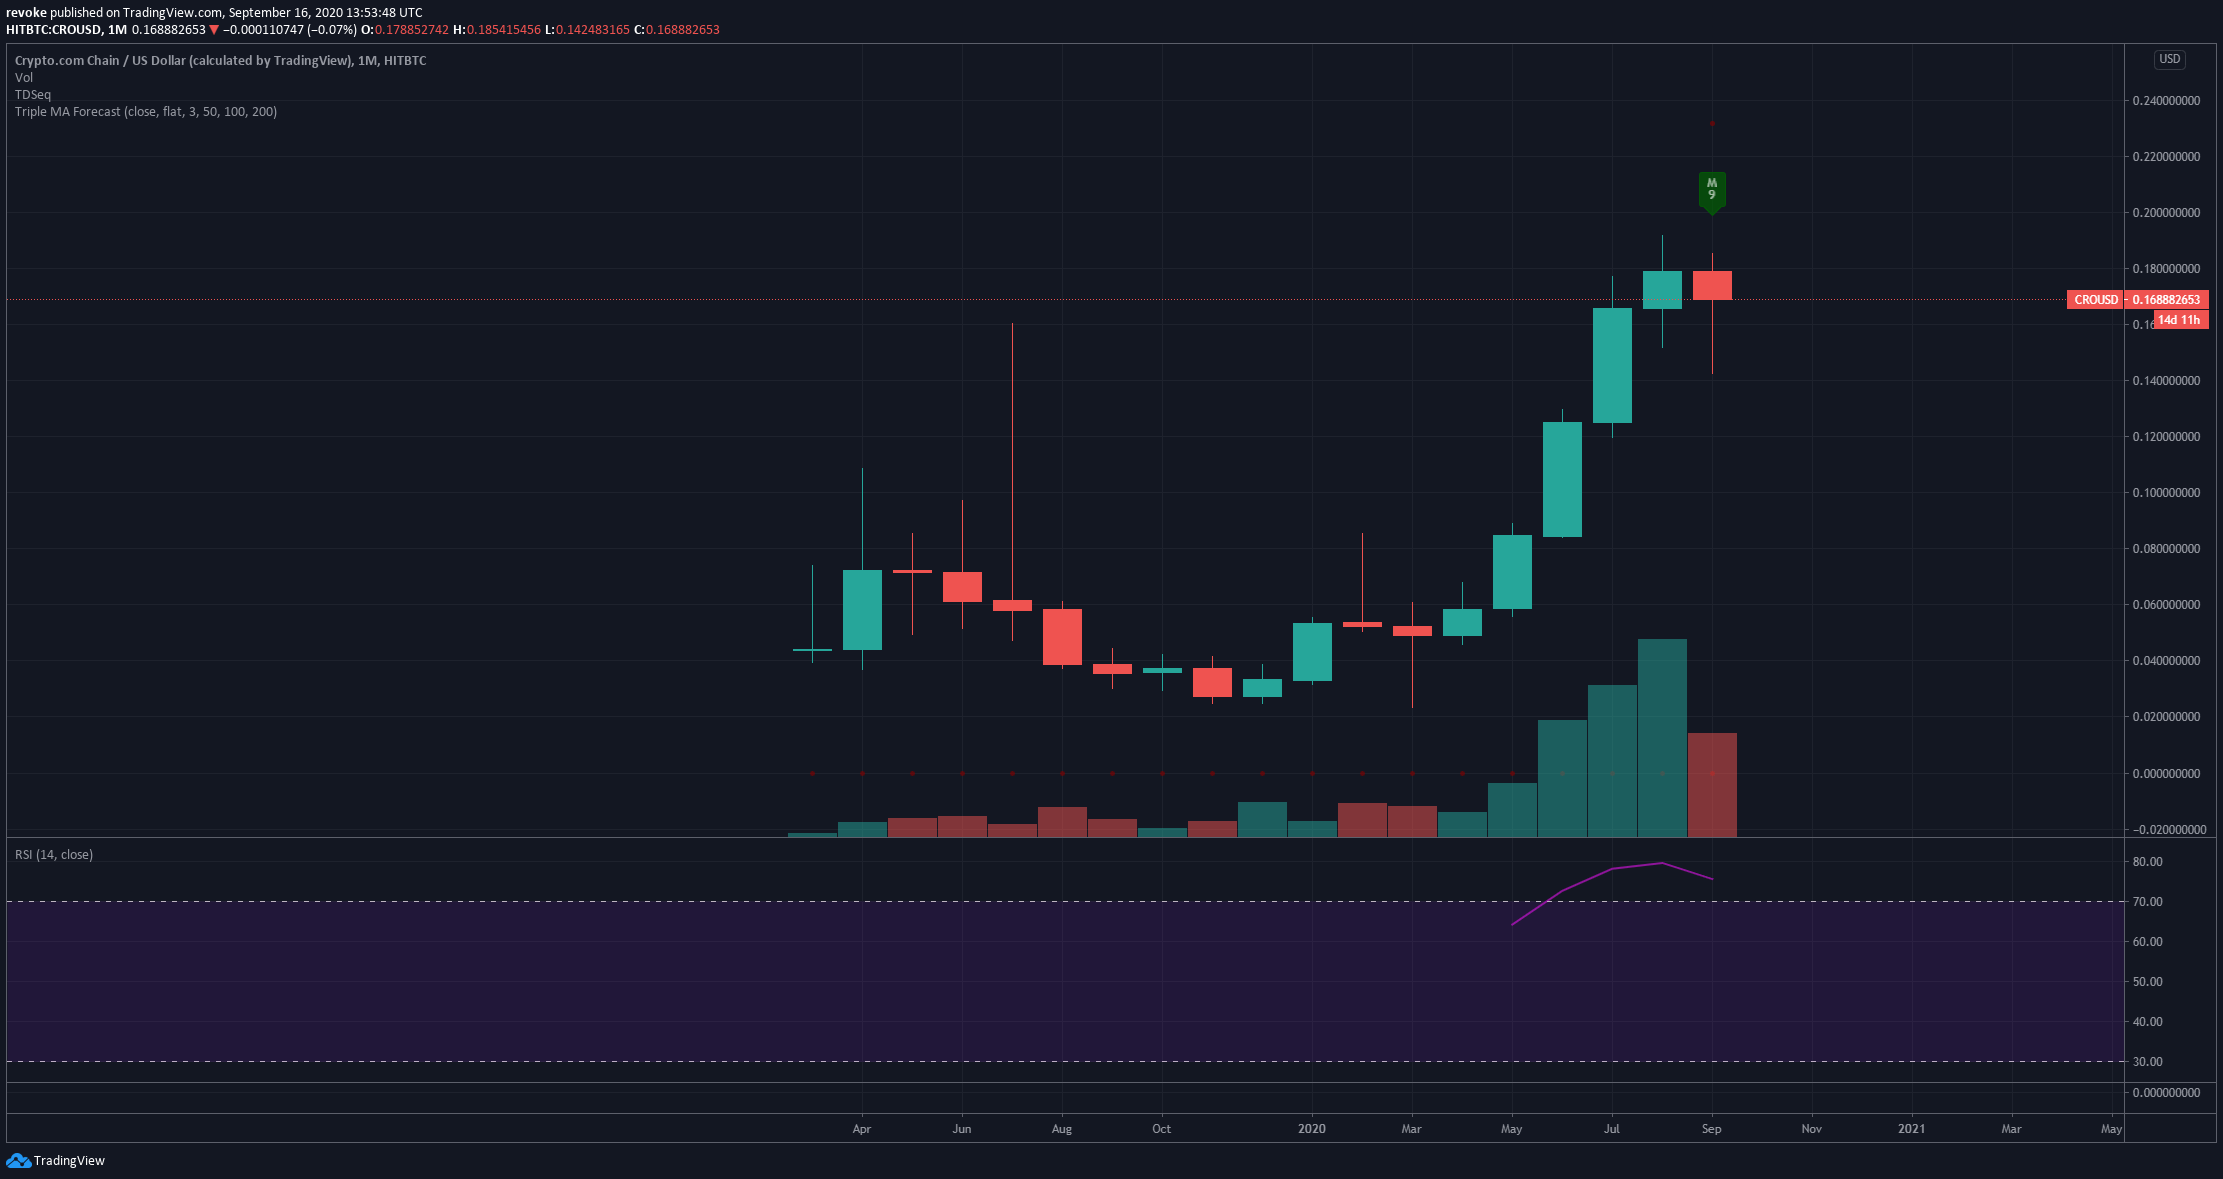
The monthly chart has been favoring the bulls for the past few months, however, the TD sequential indicator has just presented a strong sell signal.
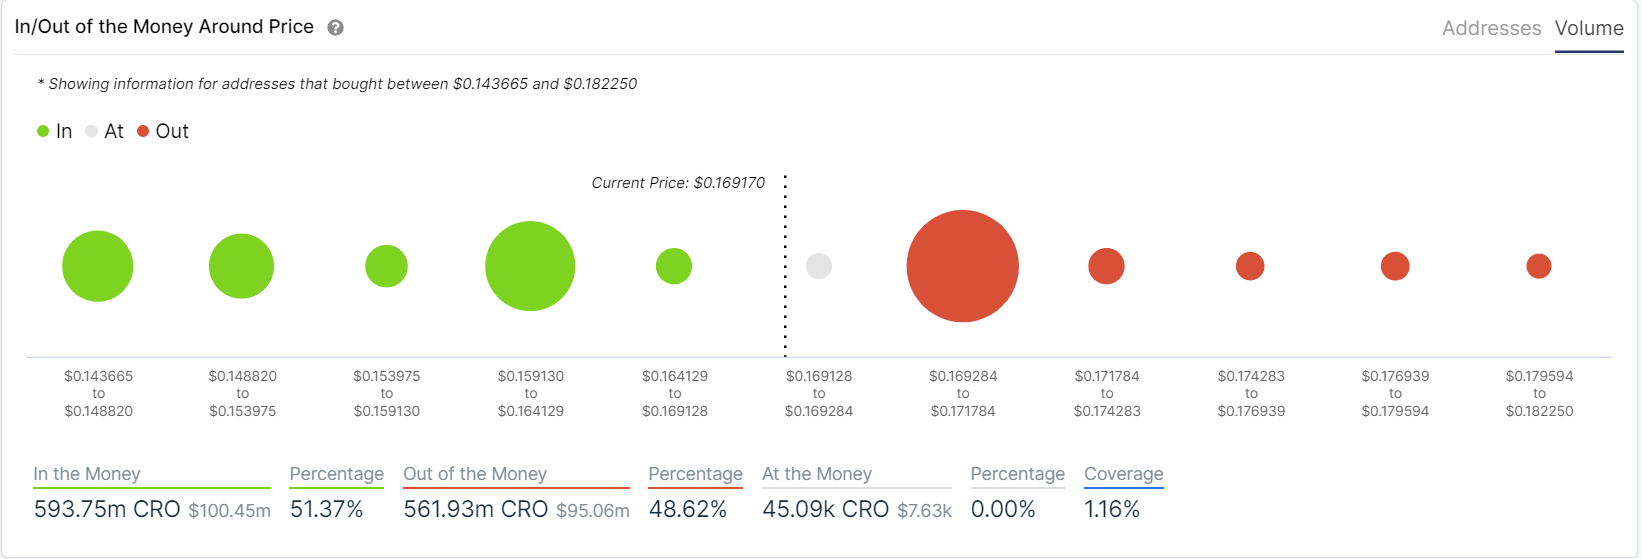
IOMAP chart for CRO
According to the IOMAP chart, there is a massive resistance level right around $0.17 but not a lot of resistance higher up. There is a small support point at $0.166 and then a stronger one at $0.162. The CRO price already slipped below both levels and touched $0.142, which is now the lowest support level.
Despite the intense selling pressure, the number of holders with at least 1,000,000 tokens has increased from a low of 43 on August 21 to 55 currently. Similarly, the number of whales with at least 10,000,000 tokens risen from 82 to 86. This metric would seem to indicate that whales are still accumulating despite the risk of a substantial correction.
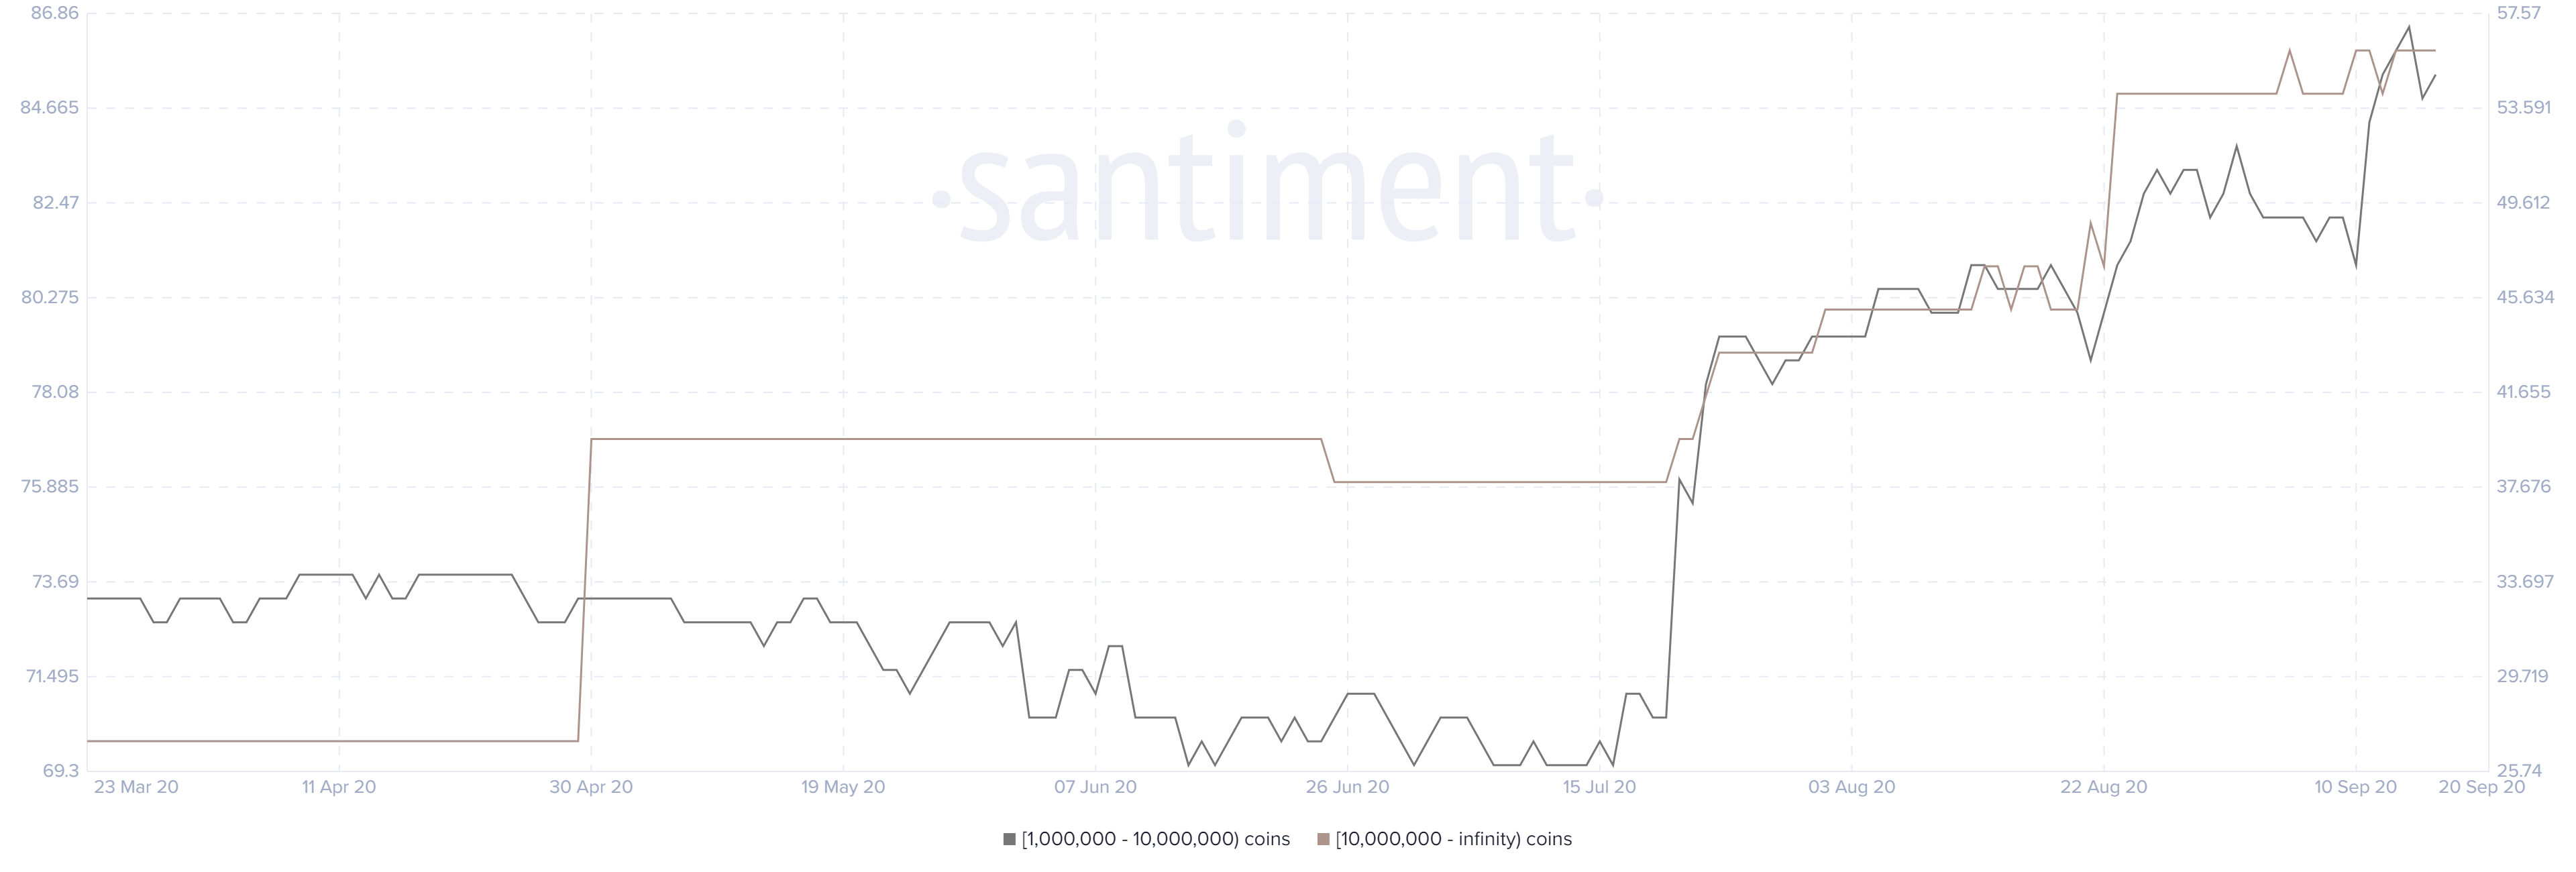
CRO holders
Similarly, the number of new addresses continues increasing. There was a massive spike of 987 new addresses on September 11, and while this number has gone down now, the overall trend is still clearly upwards.
CRO/USD Daily chart
-637358617050731065.png)
On the daily chart, bears managed to push the price below several support levels down to $0.1441. However, the bounce from the 100-MA was strong enough to boost CRO above the 50-MA. The nearest resistance level is $0.169, as indicated by the IOMAP chart; however, if the bulls can crack this level, CRO can quickly jump towards $0.1835 and eye up its all-time high again.
Author

Lorenzo Stroe
Independent Analyst
Lorenzo is an experienced Technical Analyst and Content Writer who has been working in the cryptocurrency industry since 2012. He also has a passion for trading.



