Chainlink Price Prediction: LINK bears set to wipe 25% gains
- Chainlink price rallied 25% between September 11 and 23 to create a local top at $7.235.
- The rally that originated due to the bullish divergence is at an end and hints at a reversal.
- Investors can expect LINK bears to trigger an 8% descent from the current position.
- The correction could undo the 25% gains in total and sweep sell-side liquidity below $5.370.
-637336005550289133.jpg)
Chainlink price shows an exhaustion of the bullish momentum as it approaches a key reversal zone. This development could see LINK trigger a steep correction that could undo recent gains.
Also read: Chainlink price at cross roads after a 20% climb
Chainlink price ready slide lower
Chainlink price set up a range, extending from $7.919 to $5.600 as it shed 29% between August 9 and 17. After this steep correction, LINK formed a base around $5.370 and also developed a bullish divergence with the Relative Strength Index (RSI) and Awesome Oscillator (AO).
This technical setup is when the asset produces lower lows while the momentum indicators produce a higher high. A breakout from this formation often leads to a bullish breakout. In Chainlink’s case, LINK rallied 25% between September 11 and 23. This rally was in response to the sudden sell-off noted in the second week of August.
The 62%, 70.5% and 79% are key reversal levels, where pullbacks are often hammered, leading to a continuation of the original trend. In this case, Chainlink price came close to retesting the 70.5% retracement level at $7.235, which could result in an exhaustion of the ongoing uptrend.
As Chainlink price trades around $7, investors can expect a retracement to the midpoint at $6.759. While bulls might find a temporary respite here, a retest of the 25-day and 30-day Exponential Moving Averages (EMAs) confluence at $6.450 is more than likely. This move would constitute an 8% descent from the current position.
In a highly bearish scenario, Chainlink price could wipe the 25% gains and revisit the $5.370 support level. Resting below this barrier is sell-side liquidity, which is likely to be target by bears.
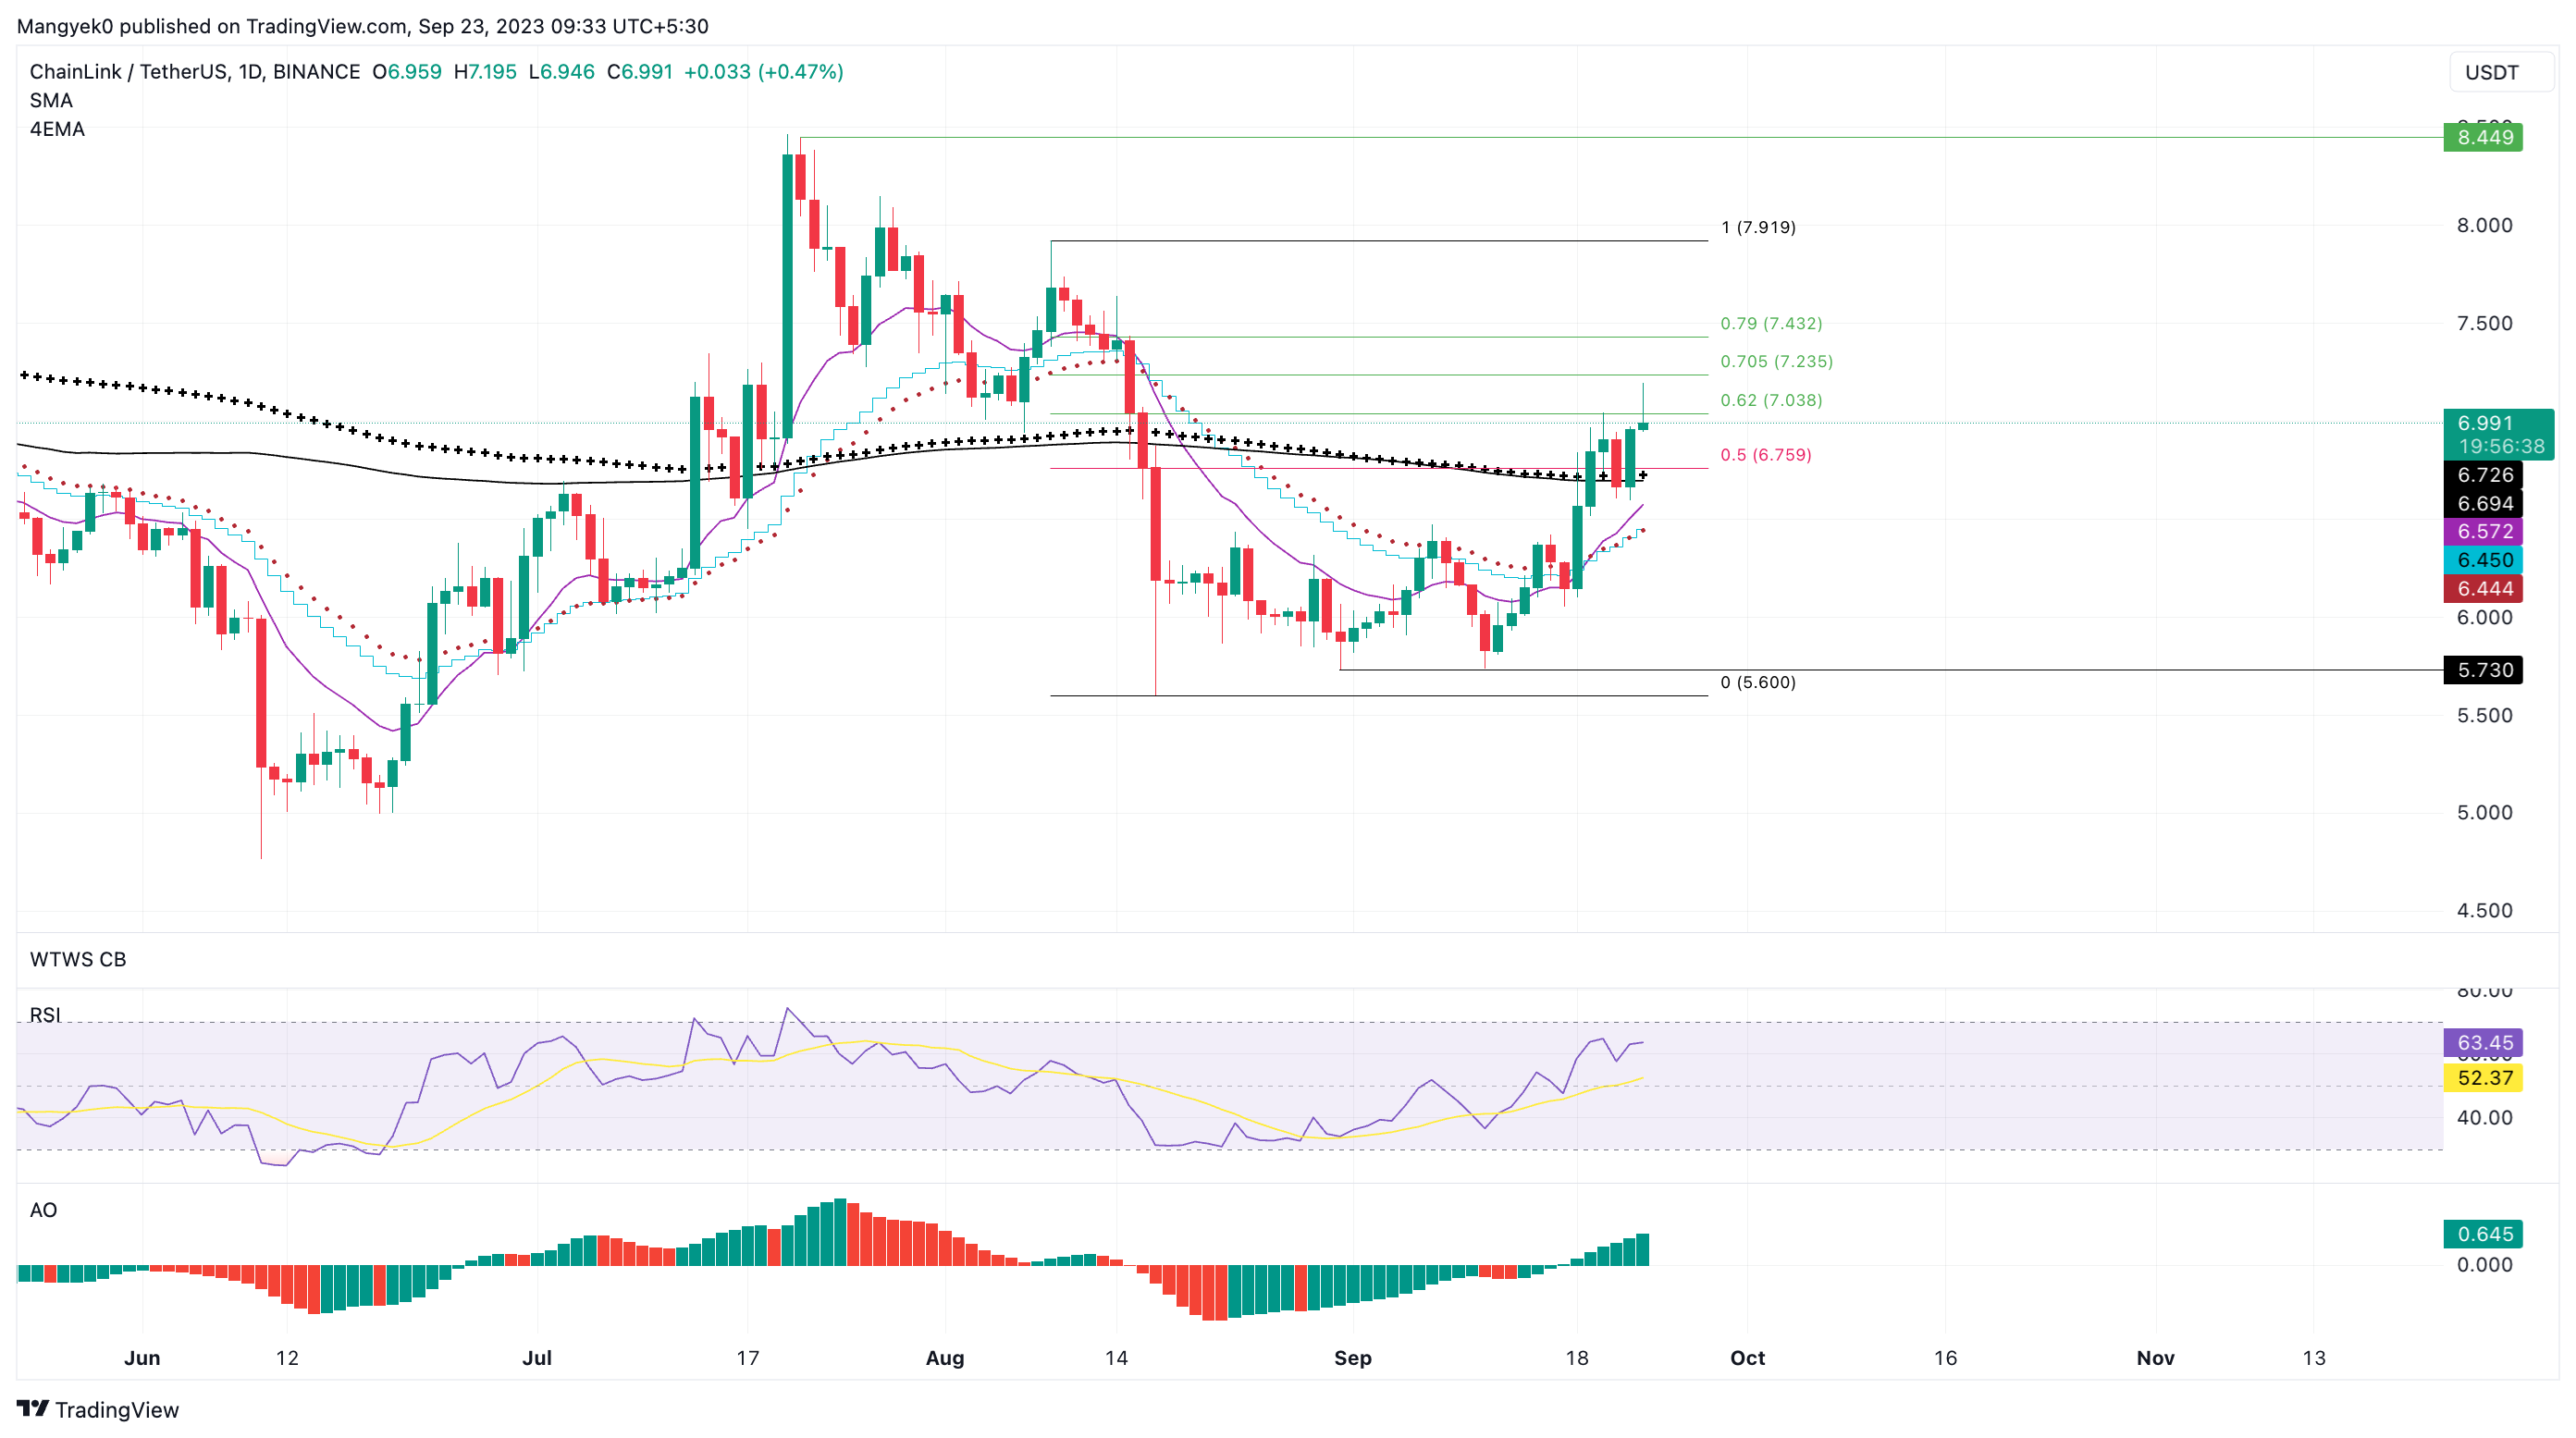
LINK/USDT 1-day chart
On the other hand, if Chainlink price manages to hold above the 50% retracement level at $6.759, it would indicate the presence of buyers. If bulls trigger a push above the $7.919 level and flip it into a support barrier, it would invalidate the bearish outlook.
In such a case, Chainlink price could then eye for a retest of the $8.449 hurdle.
Author

Akash Girimath
FXStreet
Akash Girimath is a Mechanical Engineer interested in the chaos of the financial markets. Trying to make sense of this convoluted yet fascinating space, he switched his engineering job to become a crypto reporter and analyst.


