|

Chainlink Price Prediction: Bullish outlook remains intact with first target at $25

  • Chainlink follows an ascending trend line since early January.
  • $25 aligns as interim resistance before LINK can test record highs.
  • Key support is located at $20 if price breaks below trend line.

Chainlink notched a new record high at $25.84 on Monday and staged a deep technical correction all the way down to $20. However, buyers didn't have a difficult time retaking control of the price mid-week and LINK was last seen trading near $23.

Ascending trend line continues to limit losses

LINK trades above the three-week-old ascending trend line, which was last tested during the pullback earlier in the week. As long as this line remains intact, Chainlink could try to renew its all-time high above $26. However, $25 area, where LINK closed following Monday's upsurge, is likely to act as a near-term hurdle.

Meanwhile, the Relative Strength Index (RSI) indicator on the same chart stays near 60, suggesting that buyers don't yet need to worry about LINK becoming technically overbought.
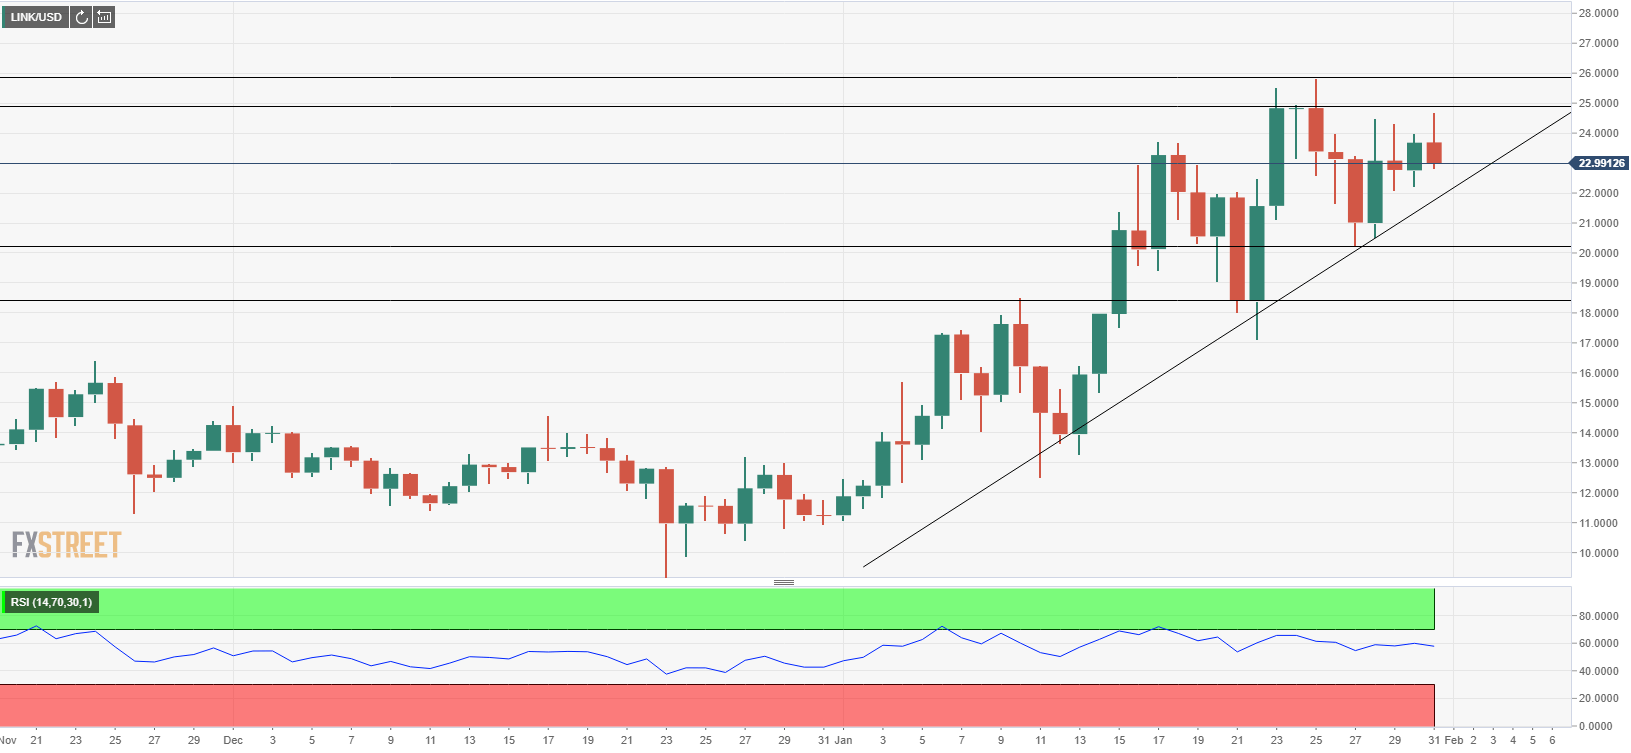
On the downside, the ascending trend line forms the initial support at $22. Moreover, IntoTheBlock's In/Out of the Money Around Price (IOMAP) model confirms this level as significant support with investors having purchased more than 12 million LINK there. 
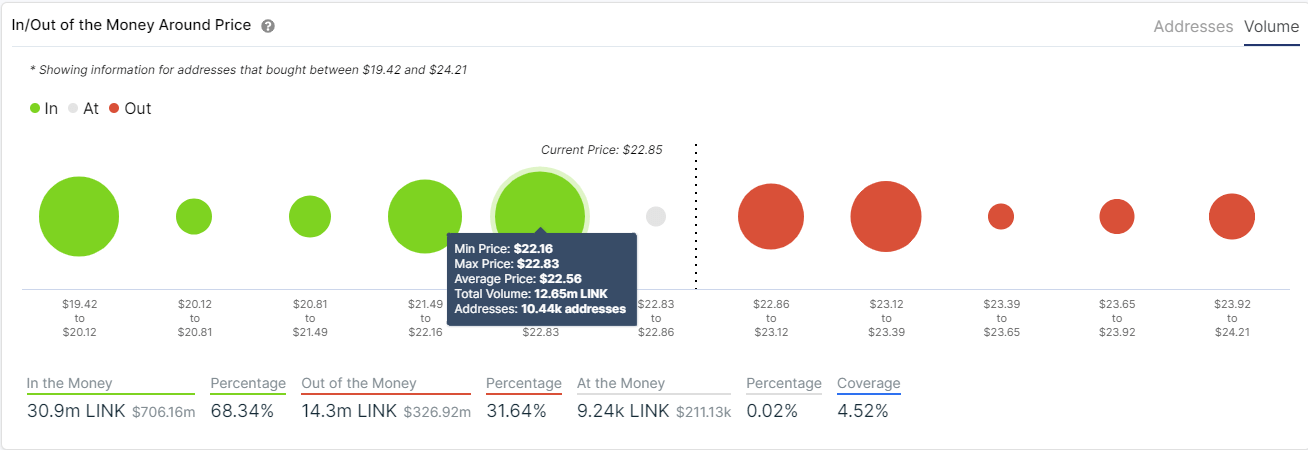
If sellers manage to drag the price below $22, Chainlink could extend its slide toward $20 psychological level, at which this week's selloff ended.

Author

Eren Sengezer

As an economist at heart, Eren Sengezer specializes in the assessment of the short-term and long-term impacts of macroeconomic data, central bank policies and political developments on financial assets.


More from Eren Sengezer
Share:

Editor's Picks

Bitcoin Weekly Forecast: BTC retreats as macro headwinds grow
Bitcoin (BTC) remains under pressure, down over 4% this week and trading around $76,900 at the time of writing on Friday. Institutional demand shows signs of weakness as spot BTC Exchange Traded Funds (ETFs) are on track to end their three-week inflow streak, recording nearly $500 million in net outflows through Thursday.
XRP falls toward key support as macro uncertainty, weak momentum cap recovery
Ripple (XRP) falls below $1.33 on Friday, marking the third consecutive day of declines. The token continues to track the broader cryptocurrency market downturn, with investors closely monitoring heightened macroeconomic uncertainty ahead of the United States (US) Consumer Price Index (CPI) release and next week’s Federal Reserve (Fed) monetary policy decision.
Crypto Today: Bitcoin, Ethereum, XRP stabilize at lower levels amid ETF outflows and macroeconomic risks
The broader cryptocurrency market is rising on Friday, with Bitcoin (BTC) trading above $77,000 after testing lower support near $76,500. Ethereum (ETH) shows signs of stability, hovering above the support provided at $2,400 despite capped upside at $2,500. Meanwhile, Ripple (XRP) holds above $1.33 after three straight days of declines, reflecting growing headwinds due to macroeconomic uncertainty.
Bitcoin pulls back as another golden cross fails to deliver
Earlier this week, Bitcoin formed a golden cross, a technical signal that occurs when the price’s 50-day moving average rises above the 200-day moving average and is conventionally viewed as a precursor to a bullish rally. Historically, however, that’s often not been the case.
Bitcoin: BTC retreats as macro headwinds grow
Bitcoin (BTC) remains under pressure, down over 4% this week and trading around $76,900 at the time of writing on Friday. Institutional demand shows signs of weakness as spot BTC Exchange Traded Funds (ETFs) are on track to end their three-week inflow streak, recording nearly $500 million in net outflows through Thursday.


