- Cardano price sets up a bullish divergence setup on the daily chart.
- The resolution of this formation could result in a 25% ascent to $0.306.
- Invalidation of the bullish thesis will occur if ADA produces a lower low below $0.231.
Cardano price has been on a downtrend for more than two months, showing seller domination. But the recent development gives hope for sidelined buyers as a quick uptrend might emerge.
Also read: Cardano price plummets despite rise in development activity and transaction volume, why?
Cardano price ready to move higher
Cardano price set up a range, extending from $0.380 to $0.231 as it shed 39% between July 14 and August 17. Currently, ADA trades at $0.245 and has produced three distinctive lower lows in the last month. But, the Relative Strength Index (RSI) and Awesome Oscillator (AO) have produced higher lows. This non-conformity is termed bullish divergence and often results in the underlying asset rallying explosively.
The result of this explosive breakout could lead Cardano price to rally 18% and tag the $0.289 hurdle. In some cases, ADA could tag the midpoint of the aforementioned range at $0.306, bringing the total gain to 25%.
A highly bullish case coupled with patient ADA holders could see Cardano price revisit the 200-day Exponential Moving Average (EMA) at $0.314. This move would constitute 28% gain.
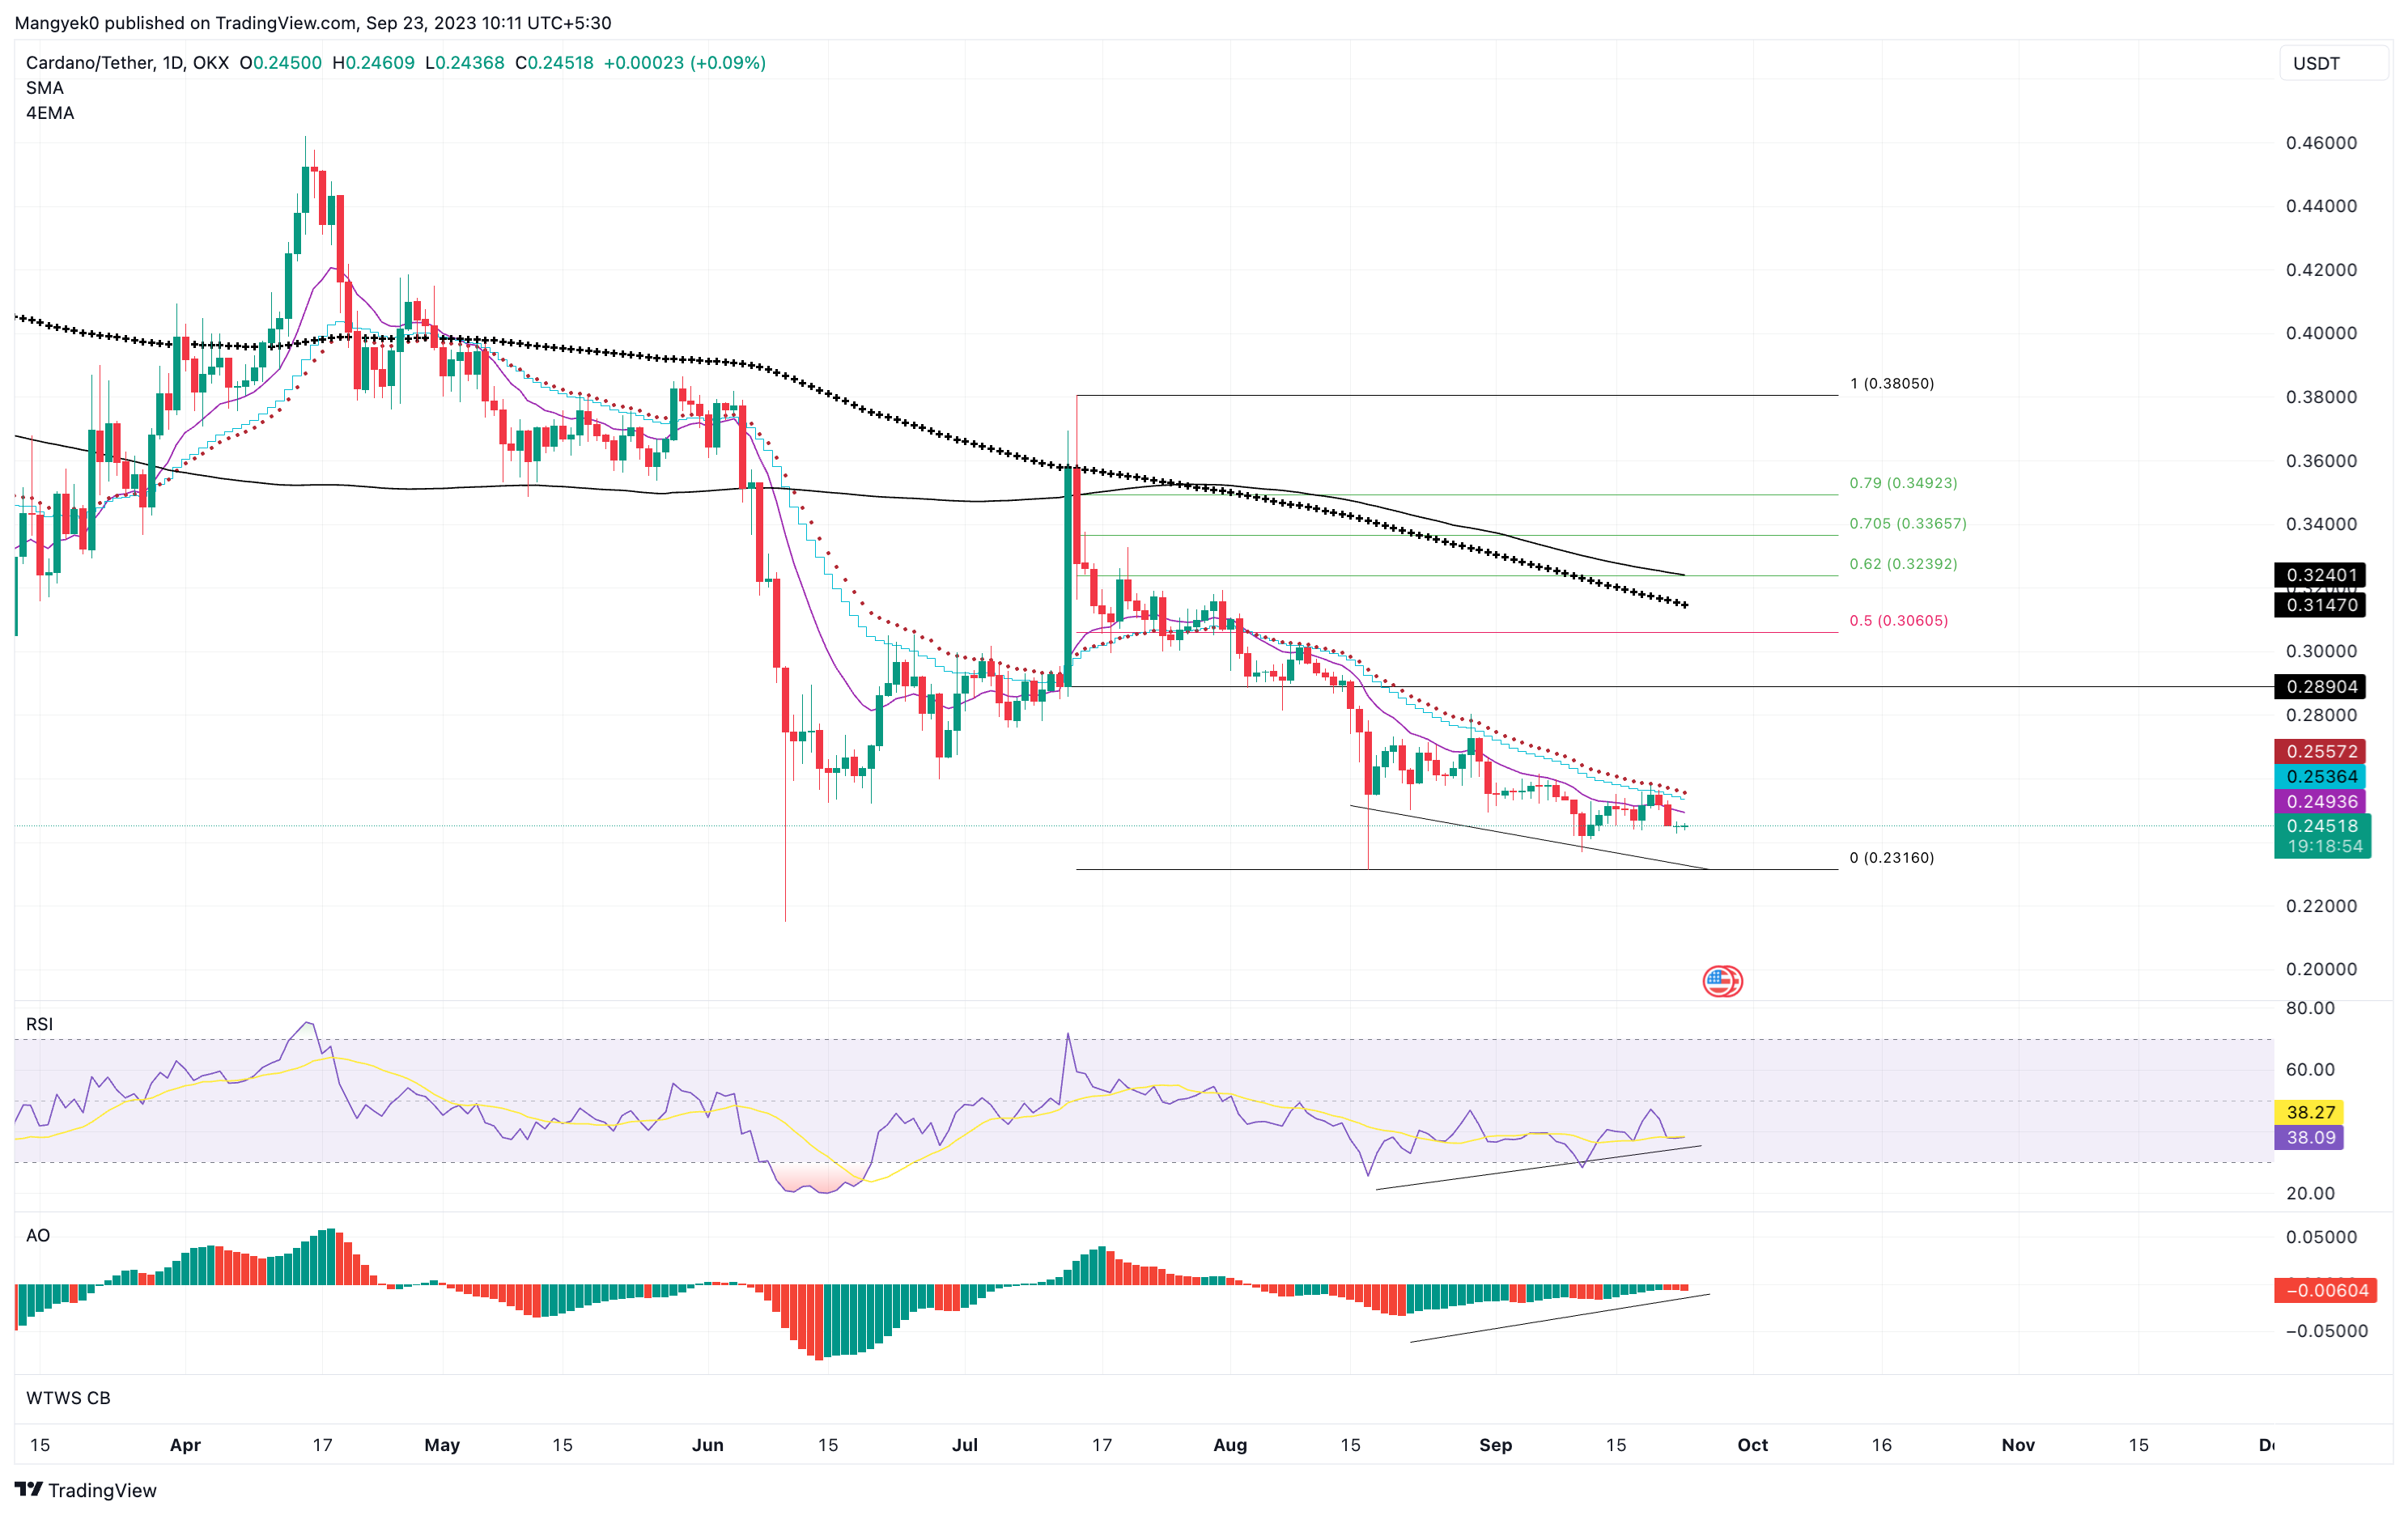
ADA/USDT 1-day chart
While the bullish outlook for Cardano price makes logical sense, a continuation of the downtrend would hamper the bullish divergence. A decisive breakdown of the range low at $0.231 that results in the production of a lower low would invalidate the bullish thesis.
Such a development could see Cardano price could drop 7% and revisit the June 10 swing low at $0.214.
Like this article? Help us with some feedback by answering this survey:
Information on these pages contains forward-looking statements that involve risks and uncertainties. Markets and instruments profiled on this page are for informational purposes only and should not in any way come across as a recommendation to buy or sell in these assets. You should do your own thorough research before making any investment decisions. FXStreet does not in any way guarantee that this information is free from mistakes, errors, or material misstatements. It also does not guarantee that this information is of a timely nature. Investing in Open Markets involves a great deal of risk, including the loss of all or a portion of your investment, as well as emotional distress. All risks, losses and costs associated with investing, including total loss of principal, are your responsibility. The views and opinions expressed in this article are those of the authors and do not necessarily reflect the official policy or position of FXStreet nor its advertisers. The author will not be held responsible for information that is found at the end of links posted on this page.
If not otherwise explicitly mentioned in the body of the article, at the time of writing, the author has no position in any stock mentioned in this article and no business relationship with any company mentioned. The author has not received compensation for writing this article, other than from FXStreet.
FXStreet and the author do not provide personalized recommendations. The author makes no representations as to the accuracy, completeness, or suitability of this information. FXStreet and the author will not be liable for any errors, omissions or any losses, injuries or damages arising from this information and its display or use. Errors and omissions excepted.
The author and FXStreet are not registered investment advisors and nothing in this article is intended to be investment advice.
Recommended Content
Editors’ Picks

Pi Network Price Forecast: A Possible bullish pattern breakout in PI teases trend reversal
Pi Network edges higher at press time on Thursday as it trades in the green for the third consecutive day. The recovery could have been driven by the launch of the new Pi Node version, while the technical outlook shares the possibility of extended gains with a bullish pattern breakout.

Sui Price Forecast: Technical breakout aims for $4.00, supported by TVL growth
Sui extends its breakout above the descending channel and reclaims the 100-day EMA at $3.07 as support. Sui’s DeFi Total Value Locked nears the $2 billion mark, indicating rising investor confidence.

Bitcoin eyes $120,000 as prospects of Fed rate cuts fuel market optimism
Bitcoin price stabilizes around 111,000 on Thursday after hitting a record high of nearly $112,000 the previous day. Fed Minutes spark renewed risk-on sentiment as it showed officials foresee interest rate cuts later this year, boosting momentum across markets.

Crypto Today: Bitcoin's new all-time high reignites risk-on sentiment as Ethereum, XRP bulls increase exposure
Bitcoin could extend its price discovery phase amid renewed risk-on sentiment following its new record high. Ethereum extends gains toward $2,880 critical resistance on the backdrop of rising spot ETF inflows.

Bitcoin: BTC ends Q2 with 30% gains, Standard Chartered eyes $200K by year-end
Bitcoin (BTC) closed a strong second quarter (Q2), recording nearly 30% in quarterly gains amid rising corporate and institutional demand and bullish market sentiment.

The Best brokers to trade EUR/USD
SPONSORED Discover the top brokers for trading EUR/USD in 2025. Our list features brokers with competitive spreads, fast execution, and powerful platforms. Whether you're a beginner or an expert, find the right partner to navigate the dynamic Forex market.