Cardano Price Forecast: ADA gearing up for a fresh downswing towards $1.2025
- ADA/USD’s rebound loses steam amid a lack of weekend love so far this Saturday.
- Rising channel breakdown on the 12-hour chart calls for a test of the $1.20 level.
- Impending bear cross and bearish RSI keep the ADA sellers hopeful.

Cardano (ADA/USD) is looking to resume the recent downtrend following a temporary reversal from weekly lows of $1.2833 reached on Friday.
ADA price staged an impressive bounce but lost legs just shy of the $1.40 mark, as sellers return amid a barrage of attacks faced by Cardano founder, Charles Hoskinson, on Twitter.
This came after Hoskinson retweeted a year-old tweet that highlighted predictions for the network’s adoption.
Ok, so @IOHK_Charles predicted this a year back. Update:No asset on $ADA, forget 1000’s of DApps not a single dapp on $ADA, only 1-2 projects announced working on.
At the press time, Cardano price is hovering around $1.34, down 0.83% on the day. The fifth most widely traded crypto coin is losing nearly 2% on a weekly basis.
ADA/USD faces a dense cluster of healthy resistance levels, remains bearish
ADA price is struggling to extend its recovery from weekly troughs, as it faces a stack of healthy resistance levels between $1.3700-$1.3800.
Around that zone, the rising channel support-turned-resistance, 21 and 50-Simple Moving Averages (SMA) intersect on the 12-hour sticks.
Therefore, a failure to find acceptance above the latter could reinforce the bearish interests, triggering a fresh downswing towards one-week lows.
The next significant support awaits at the July 2 low of $1.2778, below which the horizontal (orange) trendline support at $1.2025 will be put to test.
Cardano’s path of least resistance remains to the downside, in light of a rising challenge breakdown confirmed on the said time frame a day before.
The Relative Strength Index (RSI) edges lower within the bearish zone, adding credence to a potential move lower.
Additionally, the bearish scenario is also backed by an impending bear cross, as the 100-SMA is inching closer towards the 200-SMA, looking to cut the latter from above.
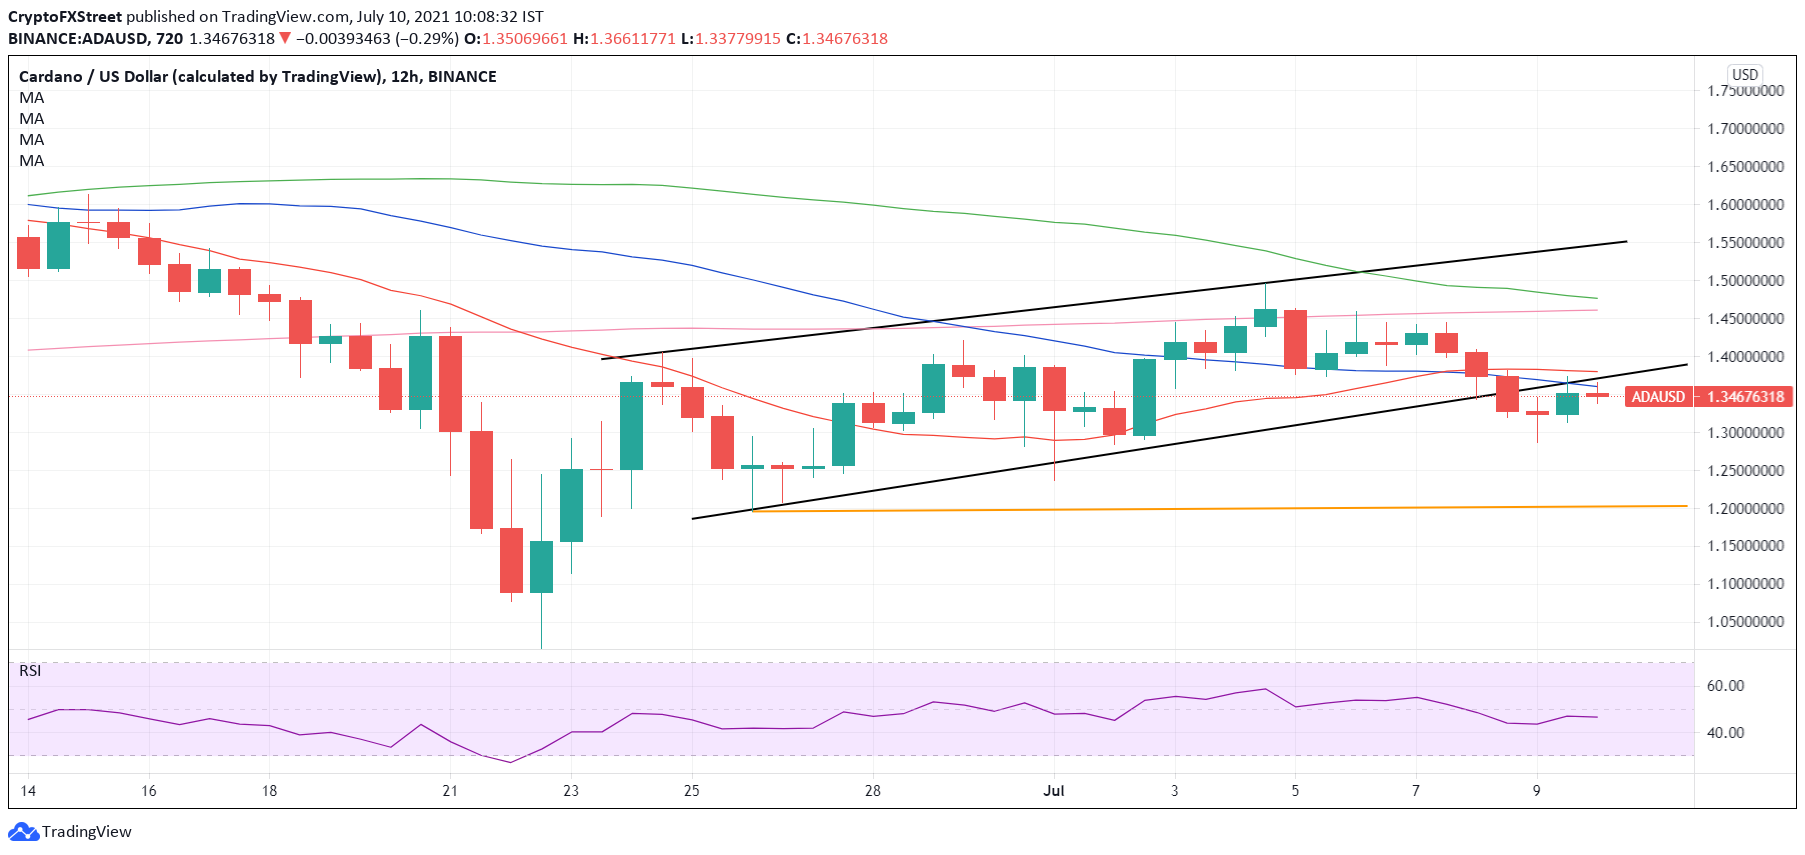
ADA/USD: 12-hour chart
On the flip side, ADA bulls could attempt a fresh rally towards the horizontal 200-SMA at $1.4610 should the critical supply zone around $1.3800 is taken out convincingly.
Further up, the mildly bearish 100-SMA at $1.4783 could be a tough nut to crack for the ADA optimists.
Author

Dhwani Mehta
FXStreet
Residing in Mumbai (India), Dhwani is a Senior Analyst and Manager of the Asian session at FXStreet. She has over 10 years of experience in analyzing and covering the global financial markets, with specialization in Forex and commodities markets.



