Can the market return to a bullish trend after a sharp dump?

The market is trying to return its lost positions as all of the coins from the top 10 list are again in the green zone.
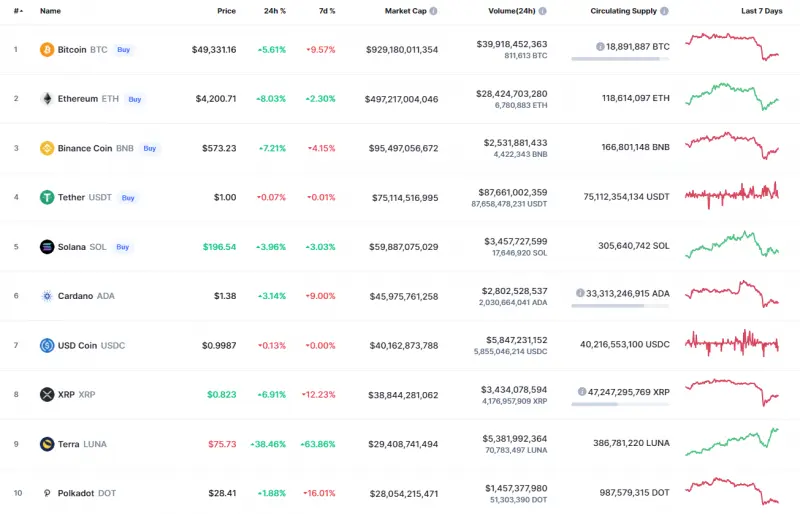
Top coins by CoinMarketCap
BTC/USD
Despite today's growth, the rate of Bitcoin (BTC) has gone down by almost 10% over the last week.
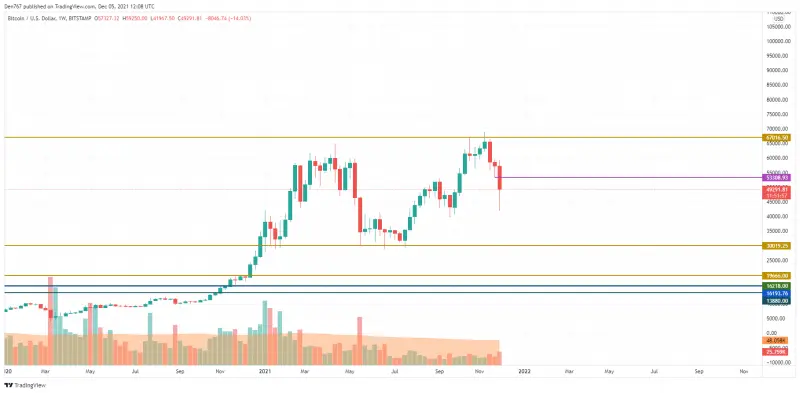
BTC/USD chart by TradingView
Analyzing the weekly time frame, Bitcoin (BTC) entered a mid-term bearish trend as it broke the vital support line and is currently trading below the $50,000 mark. Bulls need to come back above $53,000 and seize the initiative for the bullish trend to continue.
In addition, the trading volume has increased, which means that traders may have fixed their positions.
Bitcoin is trading at $49,422 at press time.
SOL/USD
Solana (SOL) is feeling much better than Bitcoin (BTC) as its rate has increased by 3% over the last week.
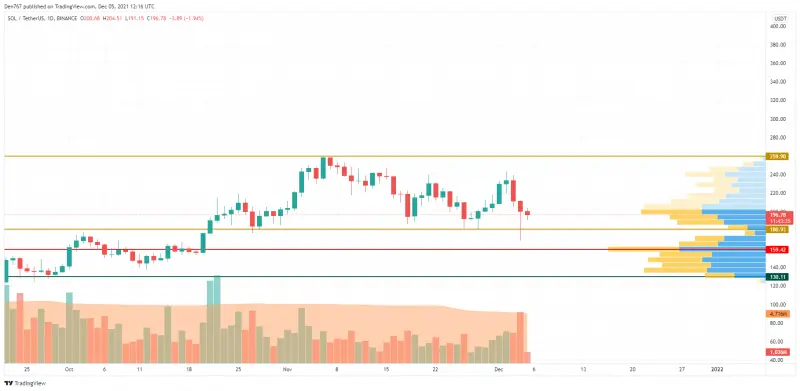
SOL/USD chart by TradingView
Solana (SOL) is trading in a wide channel between the support at $180 and the resistance at $259. Despite a recent fall, buyers hold the initiative after a false brekaout of the support. At the moment, there is a good chance to see continued sideways trading in the range of $200-$210.
SOL is trading at $196.37 at press time.
LUNA/USD
LUNA is the biggest gainer today as it already began trading higher than before the market dump. It has grown by 63% over the past seven days.
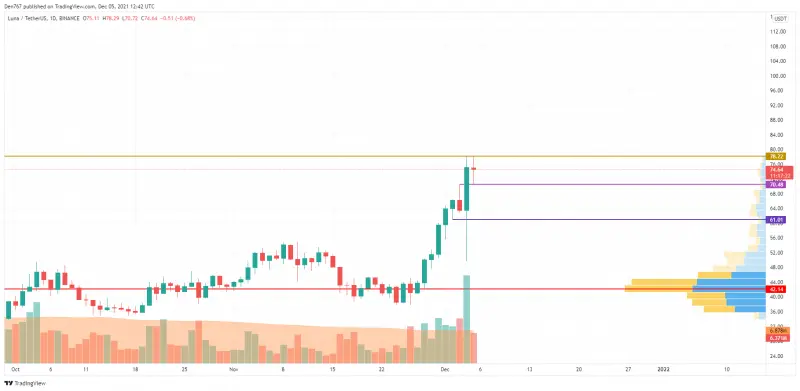
LUNA/USD chart by TradingView
LUNA set a new peak at $78 against the increased trading volume. At the moment, the more likely price action is sideways trading between $70 and $78. However, if buyers can break the resistance and fix above it, the rise may continue to $85 and above.
LUNA is trading at $74.59 at press time.
DOGE/USD
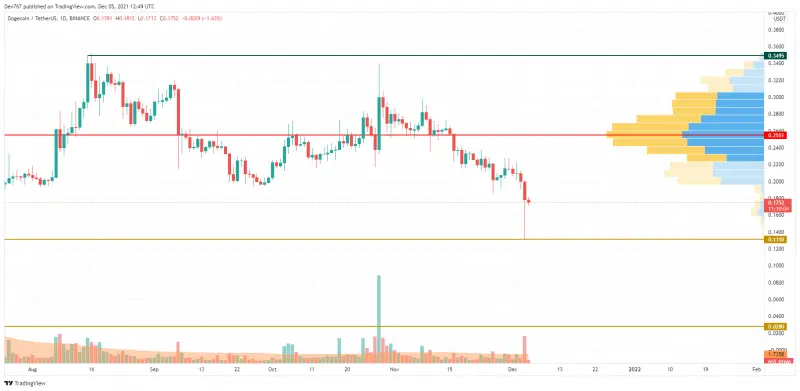
DOGE is trading opposite to LUNA with a price change over the previous week of -12.54%.
DOGE/USD chart by TradingView
DOGE is rather more bearish than bullish as it broke the vital level of $0.20 and is currently trading below it. Despite the sharp fall, buyers need to accumulate energy to restore the lost positions.
If they manage to do that and keep trading around $0.17, there is potential to see a test of the liquidity zone around $0.25.
DOGE is trading at $0.1750 at press time.
SHIB/USD
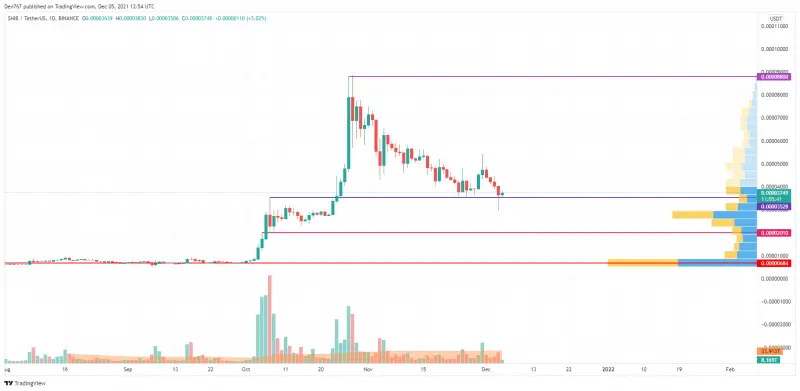
SHIB is looking better than DOGE as the price of the meme coin has gone down by only 2% over the past week.
SHIB/USD chart by Trading View
SHIB made a false breakout of the support at $0.00003528, followed by a bounceback. Until the price remains above it, bulls continue controlling the situation. However, if they lose the initiative, the fall may continue to the nearest support at $0.00002010. Overall, the level of $0.00003528 is very important for buyers if they want to come back to the previous levels.
SHIB is trading at $0.00003728 at press time.
Read full original article on U.Today
Author

Denys Serhiichuk
U.Today
With more than 5 years of trading, Denys has a deep knowledge of both technical and fundamental market analysis.



