Can DYDX price overcome two critical hurdles and rally 25%?
- DYDX price approaches the $2.84 resistance, hoping for a breakout.
- A successful flip into a support floor could trigger a 25% rally to $3.60.
- A daily candlestick close below $2.58 will invalidate the bullish thesis for DYDX.
DYDX price is making another comeback that could lead to handsome gains if it is successful. Investors need to watch out for the 12-hour momentum indicators, which clearly signal an imminent explosive upward move for the altcoin.
Read more: DYDX Price Forecast: dYdX holders likely to witness 20% gains
DYDX price edges closer to breakout
DYDX price created a range, extending from $2.84 to $4.36, as it shed 35% of its value between November 15 and 21. The range low at $2.84 played a key role in supporting the price action up to January 3. But a sudden selling pressure spike back then pushed the altcoin to breach the support floor and flip it into a resistance level.
Since then, DYDX price has been hovering below it for nearly a month, with one failed attempt at a breakout.
The Relative Strength Index (RSI) has cleared the 50 mean level and is now waiting on the Awesome Oscillator (AO) to do the same. A successful flip of the AO above its mean level will confirm the start of a bull rally.
Often, the 12-hour time frame is regarded as key by day traders, and they take lower time frame actions based on the signals spotted here. As an example, investors can take a look at the AO flipping above the zero line and its effect on the DYDX price.
On December 22, DYDX price rallied 10% as the AO flipped above the zero line. Similarly, a 13.5% move was spotted between January 14 and 18 as the momentum indicator climbed above the baseline.
Hence, a similar breakout, if accompanied by a flip of the $2.84 level into a support floor, will add wings to the rally. This move could potentially trigger an extension of the upswing to the aforementioned range’s midpoint at $3.60. However, this upswing needs to overcome the declining resistance level that connects the November 25 and December 27 swing highs.
In total, this move would constitute a 25% gain from the $2.84 level.
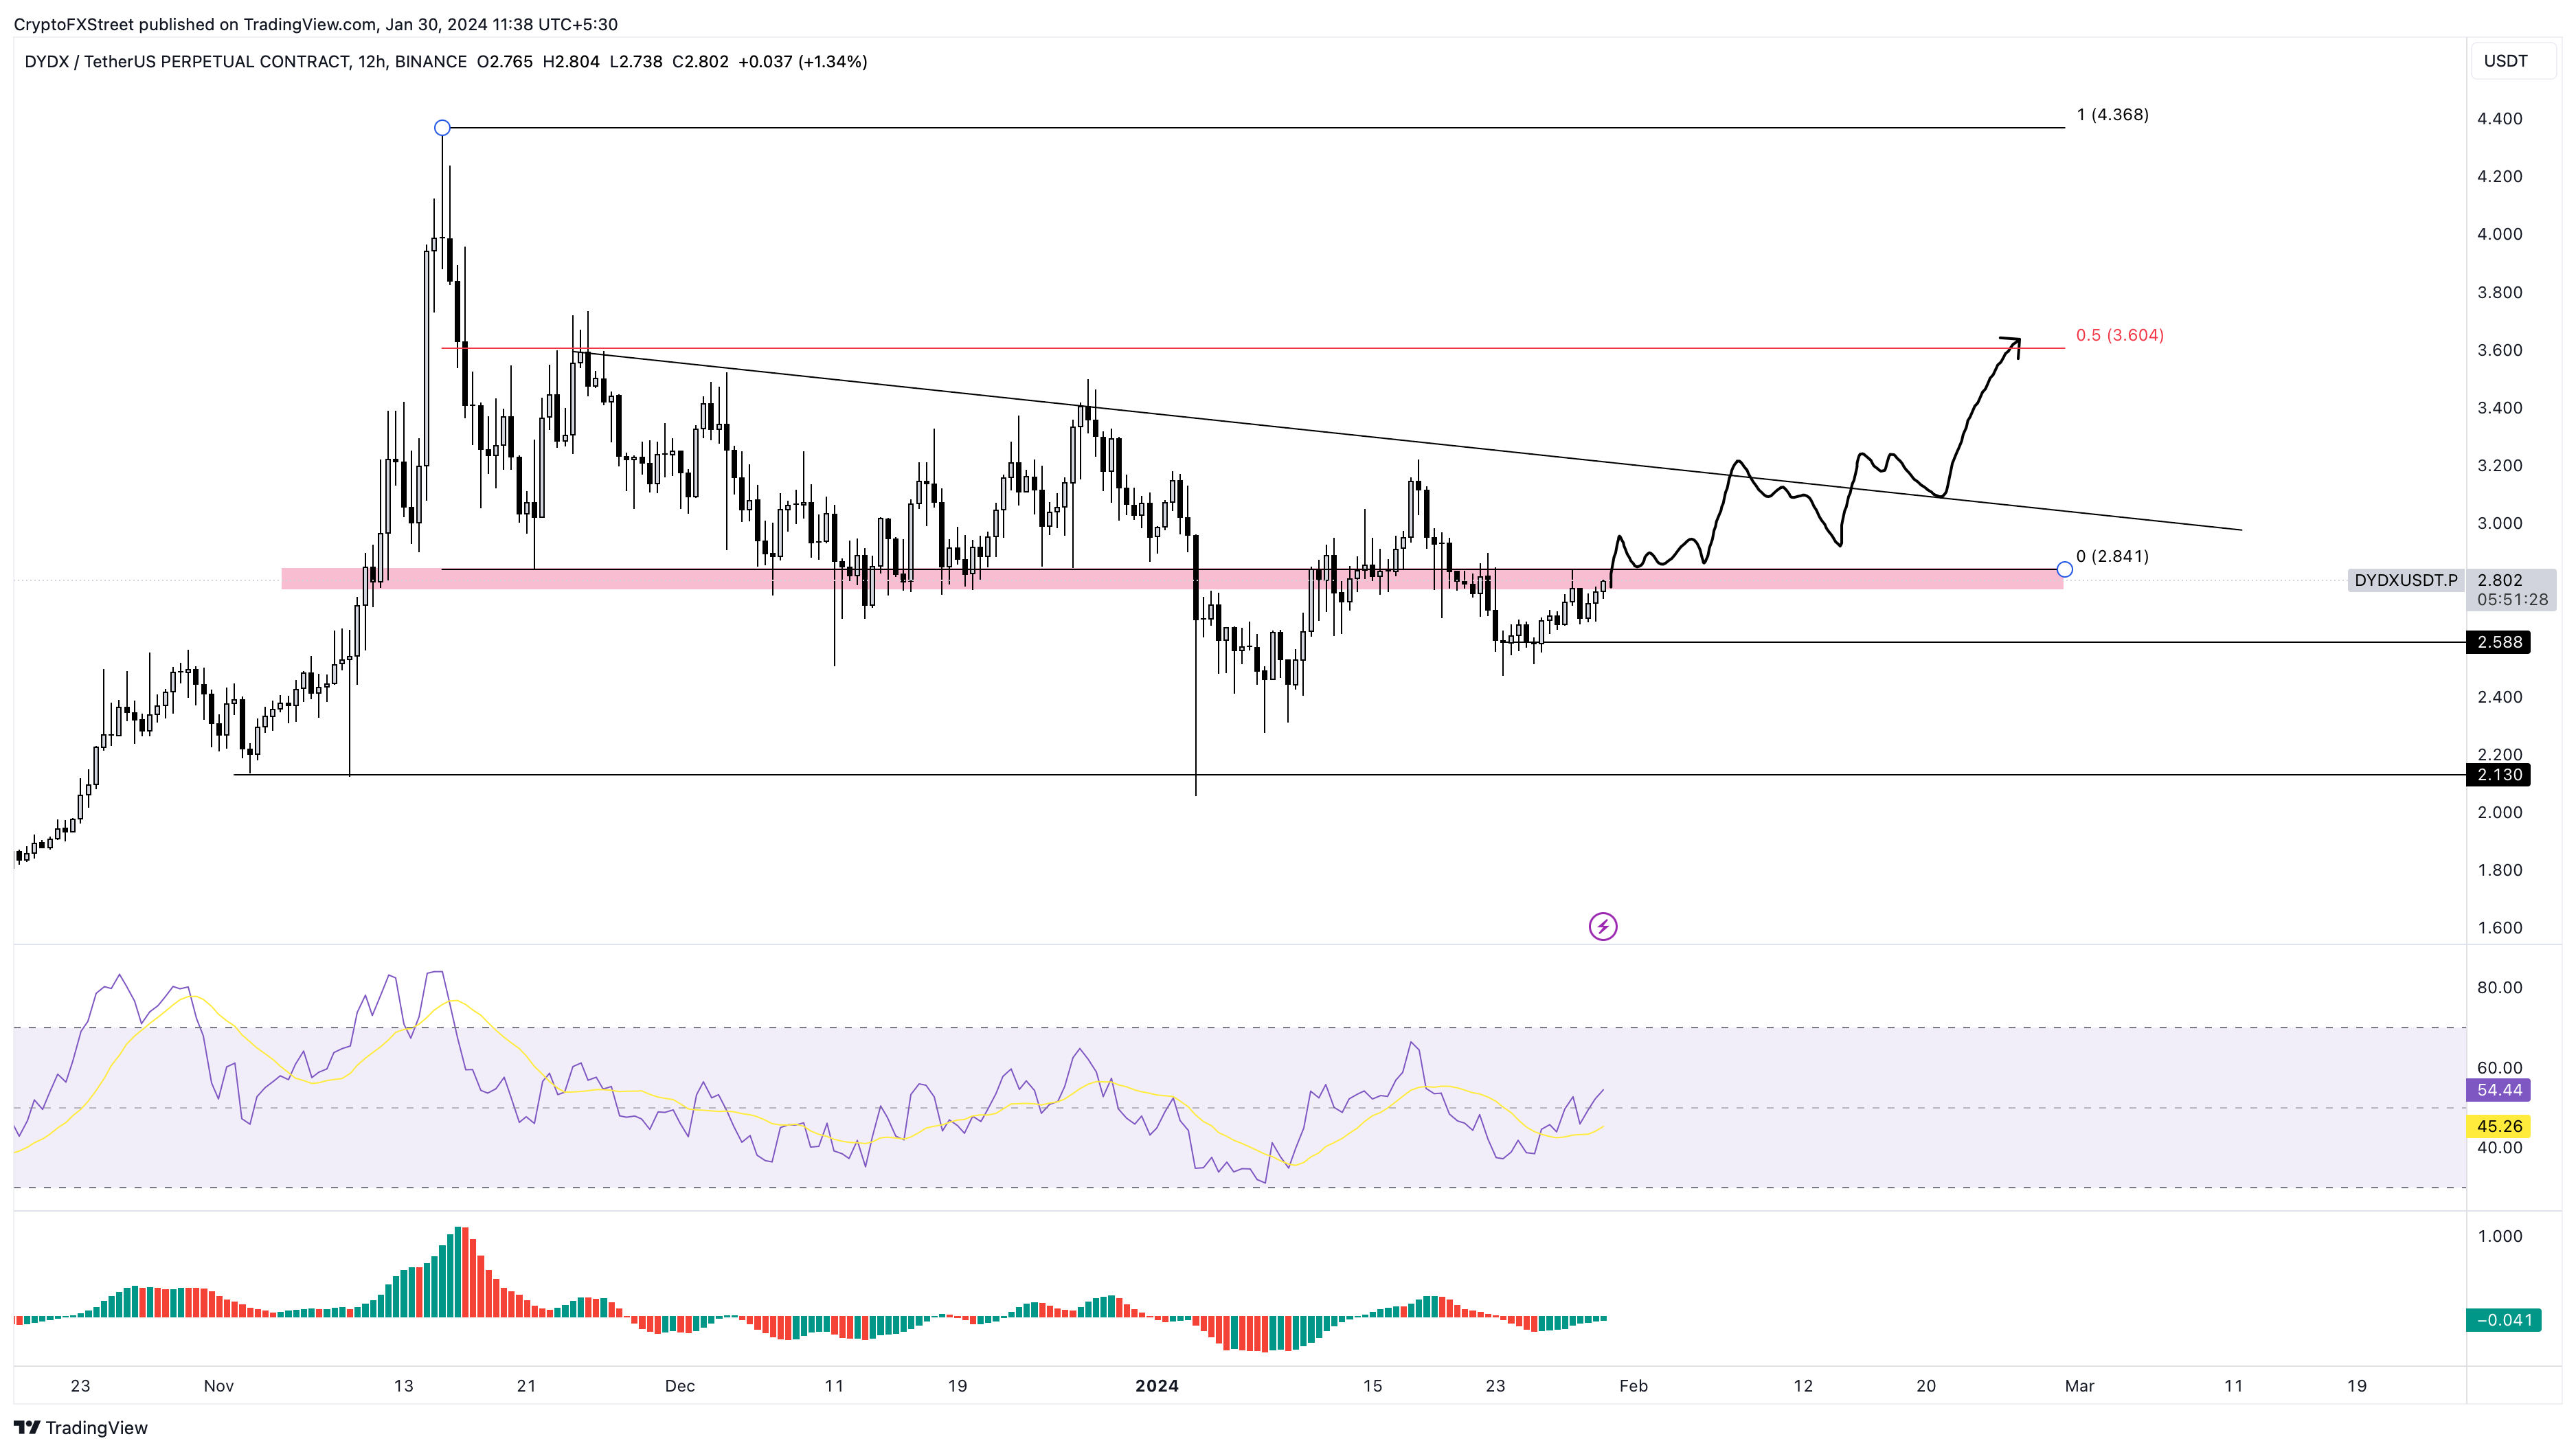
DYDX/USDT 12-hour chart
On the other hand, if DYDX price fails to overcome the $2.84 hurdle and instead gets rejected, investors should expect a retest of the $2.58 support floor. A daily candlestick close below this level will create a lower low and invalidate the bullish thesis.
Such a development could see DYDX price trigger an 18% correction to the next key foothold at $2.13, especially if the selling pressure fails to cease.
Also read: Four altcoins most likely to bounce during Christmas holidays: LTC, STORJ, ILV, DYDX
Author

Akash Girimath
FXStreet
Akash Girimath is a Mechanical Engineer interested in the chaos of the financial markets. Trying to make sense of this convoluted yet fascinating space, he switched his engineering job to become a crypto reporter and analyst.


