Can bulls hold the initiative and keep the rise in the mid-term scenario?
Bulls have seized the initiative as most of the coins are trading in the green zone.

Top coins by CoinMarketCap
BTC/USD
Bitcoin (BTC) is the only falling coin out of the top 10 coins, going down by 1.57%.
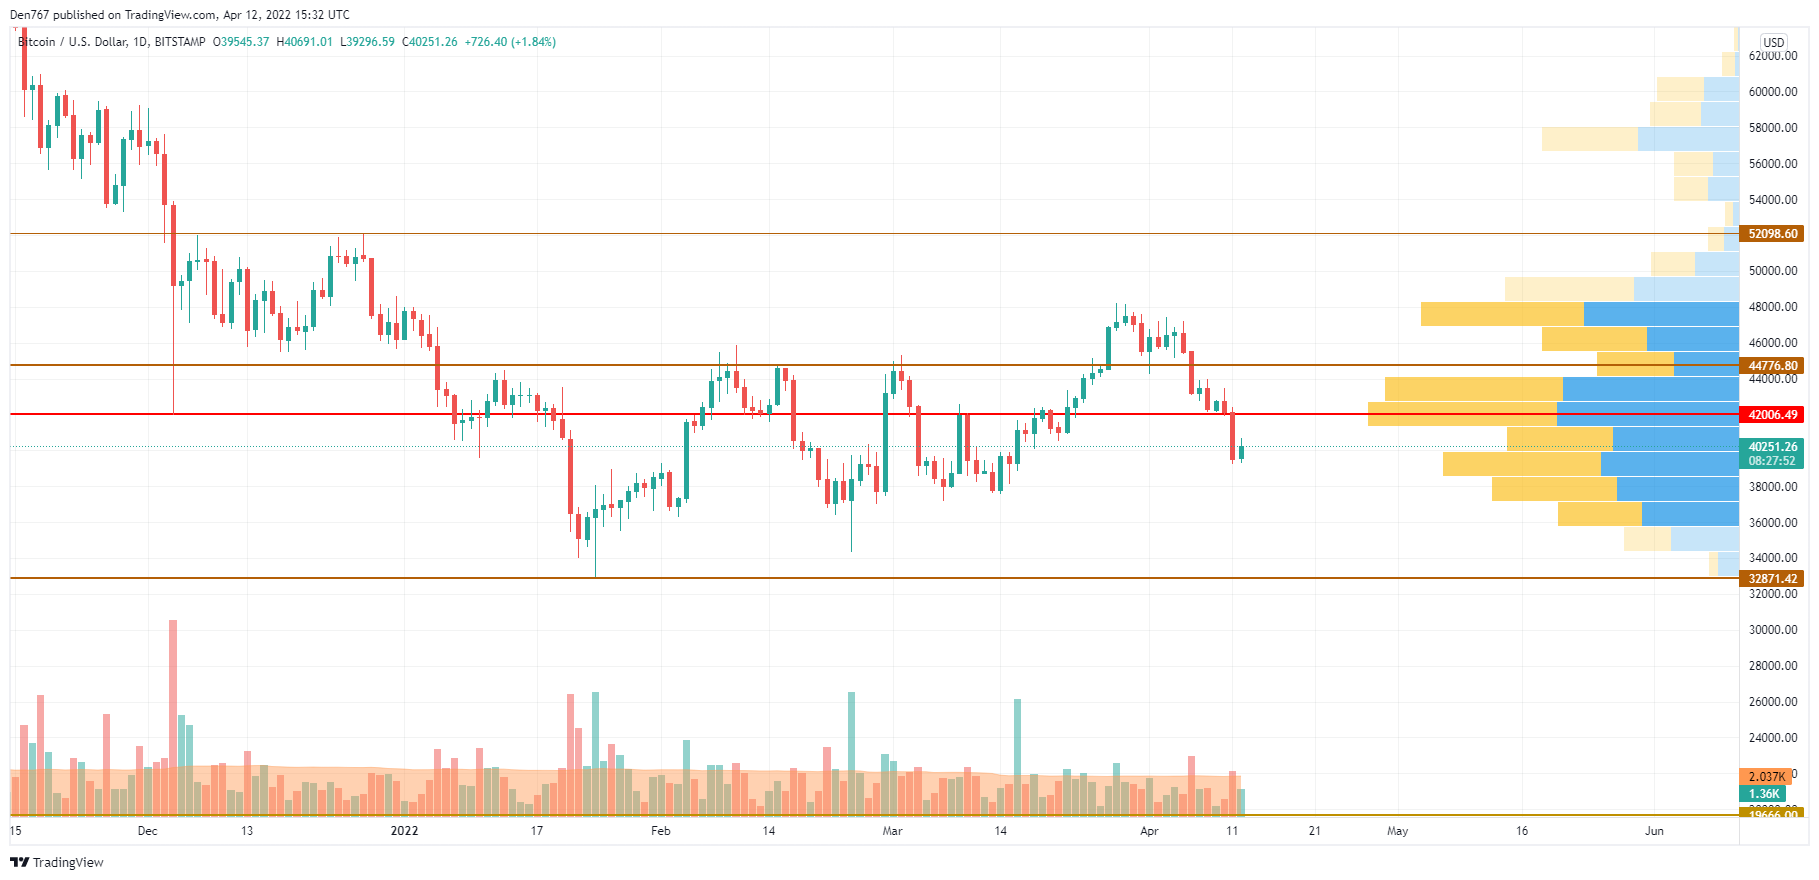
BTC/USD chart by TradingView
On the daily chart, Bitcoin (BTC) is trading below the zone of the most liquidity at $42,000. As long as the rate cannot come back above it, it means that bears are more powerful than bulls. In this case, one can expect a further slight decline to the area around $39,000 by the end of the week.
Bitcoin is trading at $40,370 at press time.
ADA/USD
The rate of Cardano (ADA) has risen by 2.12% since yesterday.
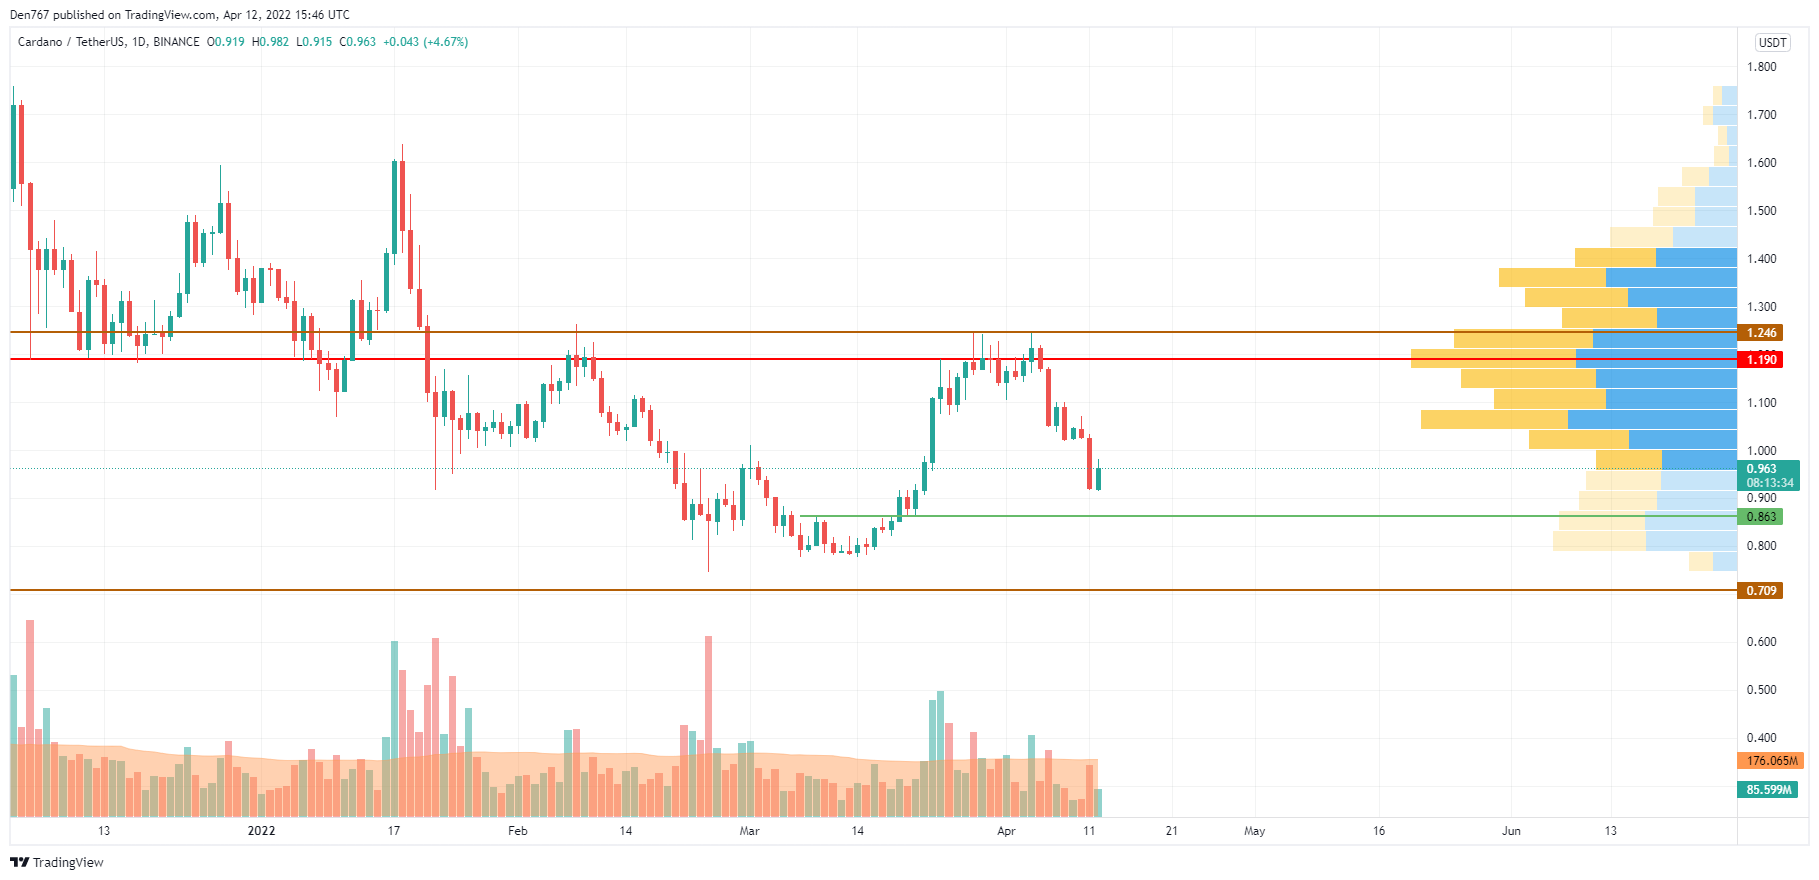
ADA/USD chart by Trading View
Despite today's rise, Cardano (ADA) is trading similar to BTC as bulls could not keep the rise, with the price going below the vital $1 mark. Thus, the buying trading volume remains low, which confirms buyers' weakness.
Respectively, the more likely scenario is the test of the green local support level at $0.863 soon.
ADA is trading at $0.96 at press time.
BNB/USD
Binance Coin (BNB) has gained more than Cardano (ADA), with growth of almost 3%.
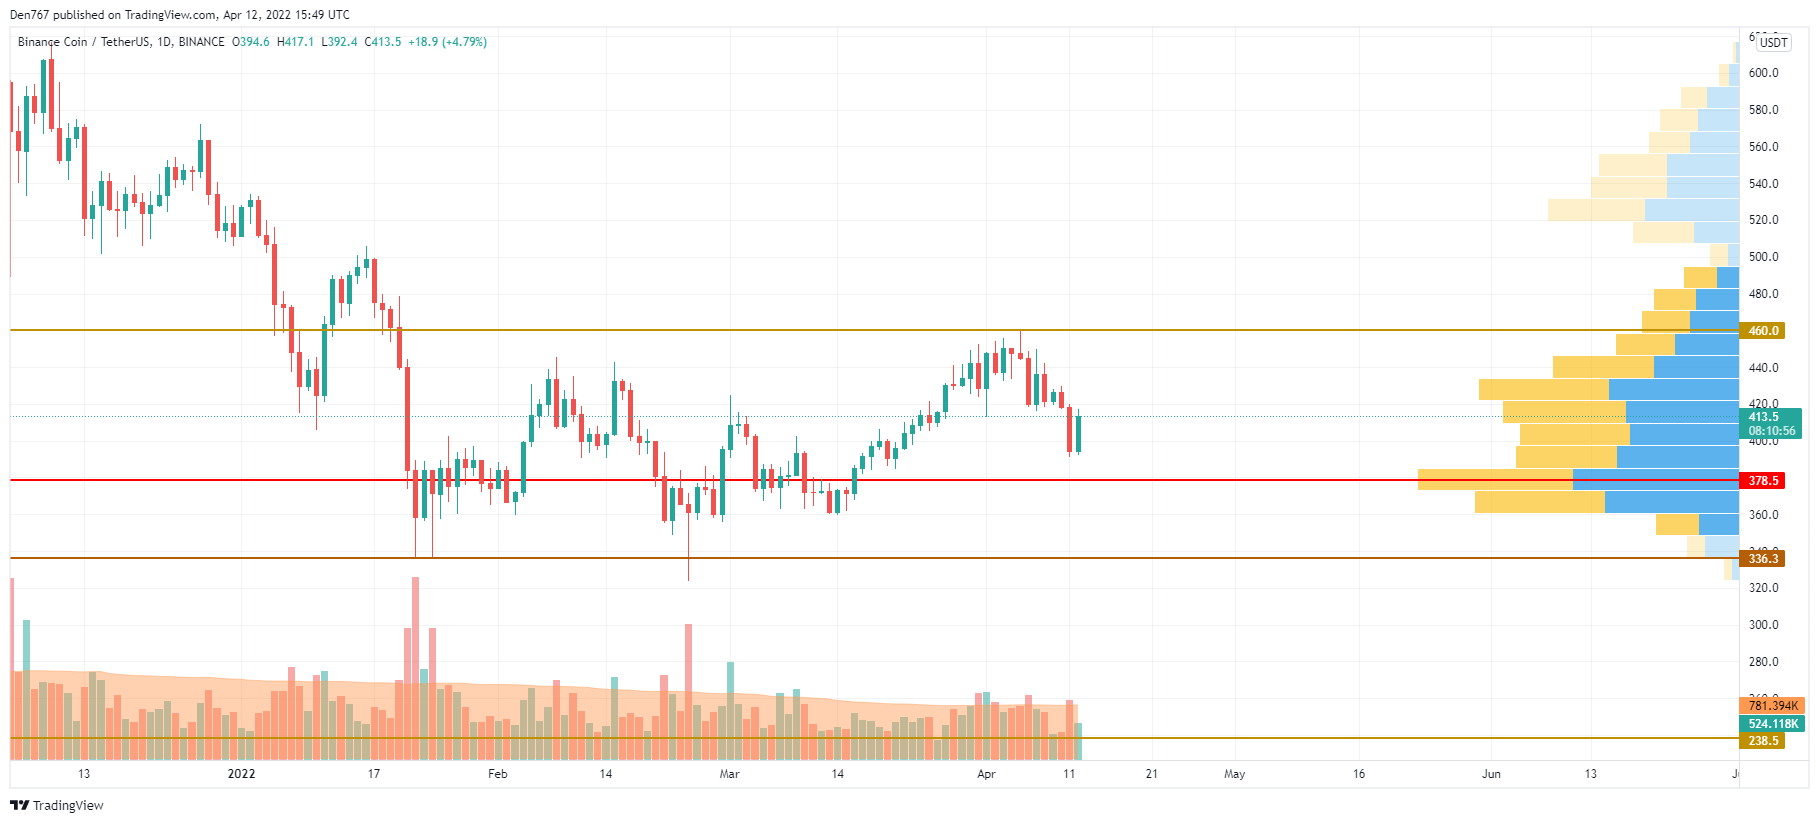
BNB/USD chart by TradingView
Binance Coin (BNB) is more bullish than Cardano (ADA) on the daily chart, as the rate has bounced off the $400 mark. If bulls can hold this level untli the end of the day, there is a possibility to see a return to $460 within the next few days.
BNB is trading at $413 at press time.
LUNA/USD
LUNA has shown less growth than the other coins from the list, going up by only 1.83%.
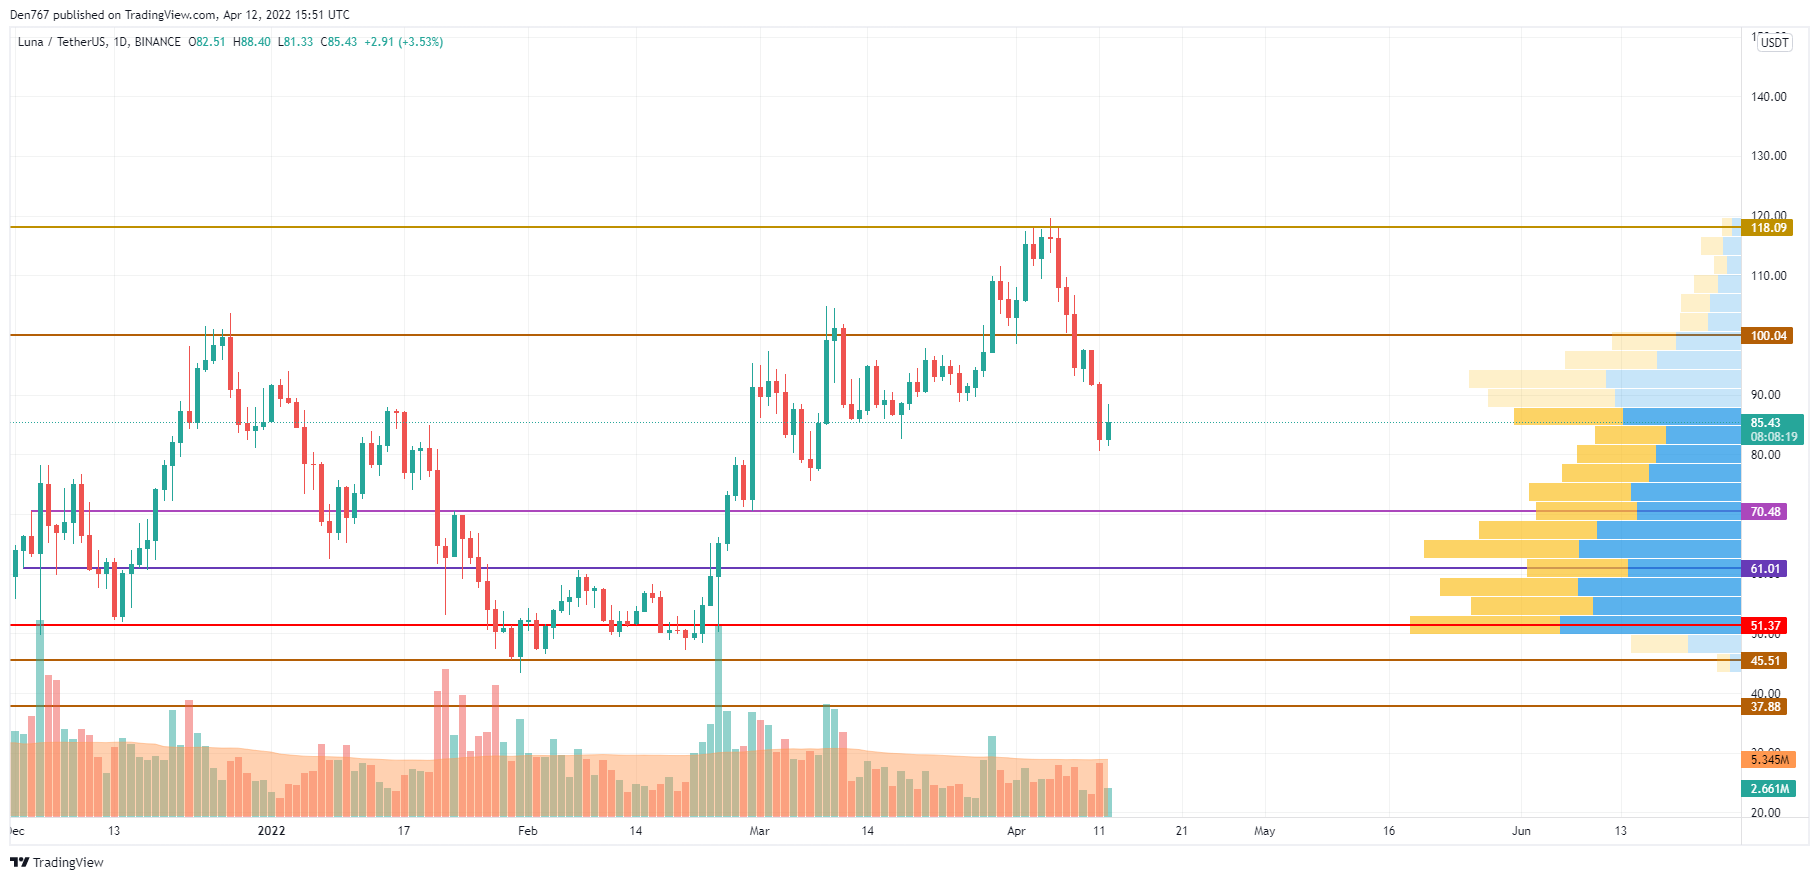
LUNA/USD chart by TradingView
LUNA is trading in a wide channel between the support at $70 and the local resistance level at $100. If bulls can accumulate the energy, one can expect the test of this vital mark. If that happens, the growth may continue up to $118.
LUNA is trading at $85.42 at press time.
SOL/USD
Solana (SOL) is the biggest gainer today, rising by 4.88% over the past 24 hours.
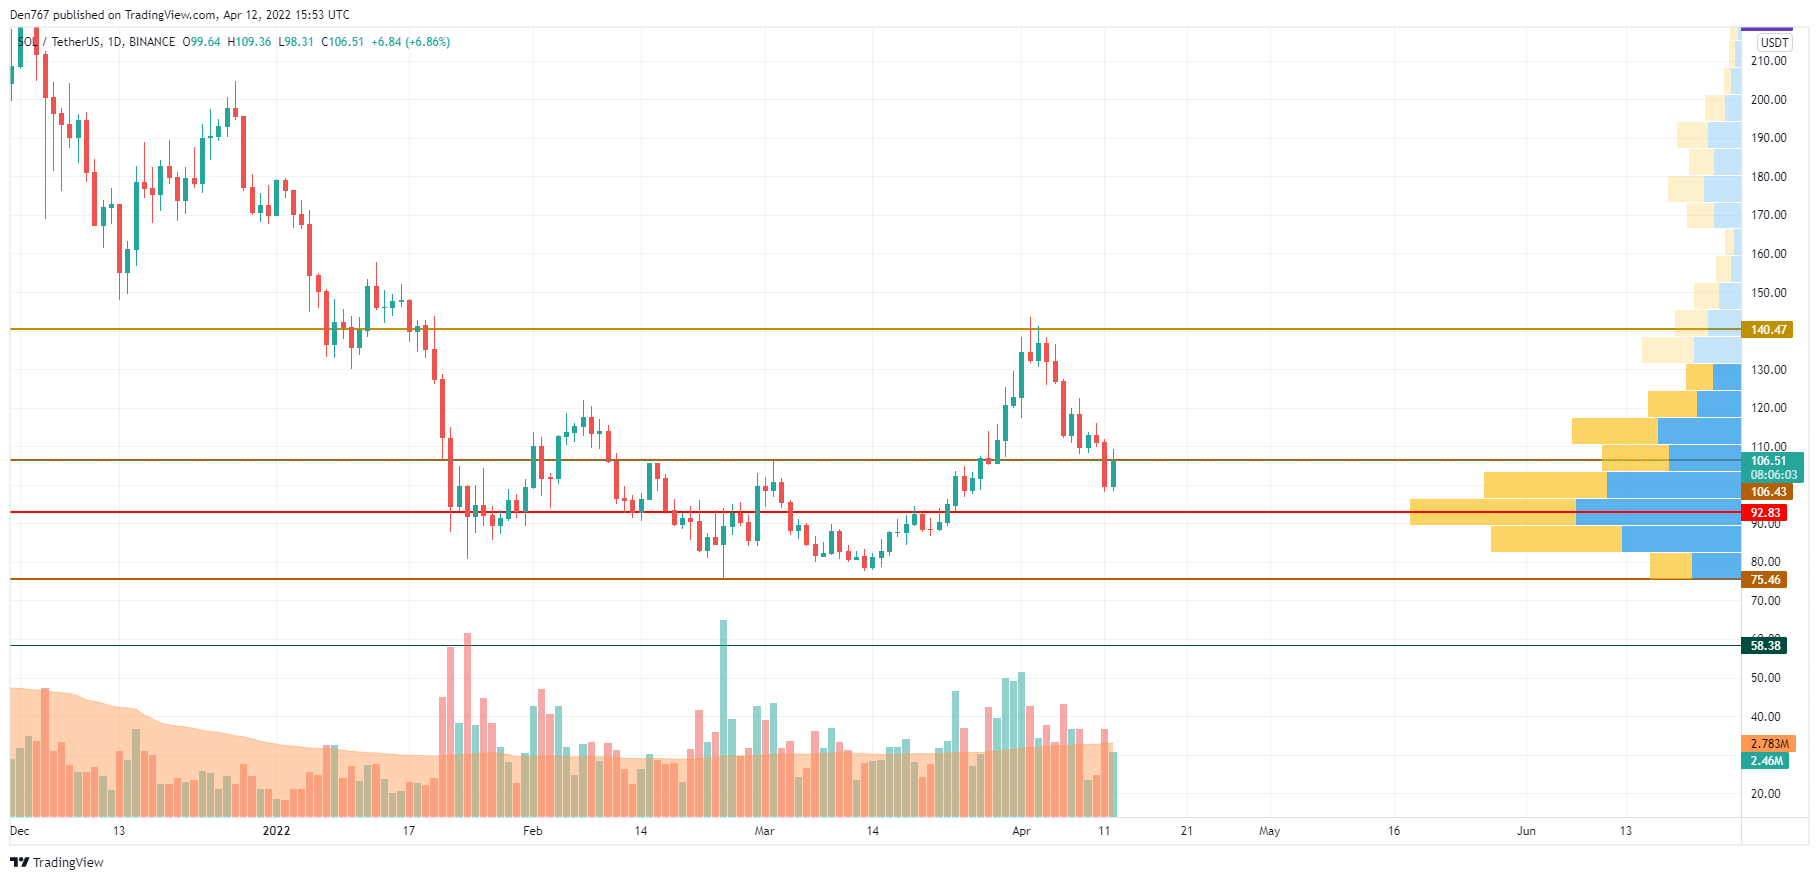
SOL/USD chart by TradingView
SOL is trying to break the level at $106.36 against the high trading volume. If it can manage to do that by the end of the day, the rise may lead the price of the altcoin to the zone of $120-$150 until the end of the month.
SOL is trading at $106.24 at press time.
Read full original article on U.Today
Author

Denys Serhiichuk
U.Today
With more than 5 years of trading, Denys has a deep knowledge of both technical and fundamental market analysis.


