BTC/USD technical analysis: We are in a technically complex zone
- Bitcoin is trading 1.46% higher today and is consolidating after Saturday's move higher.
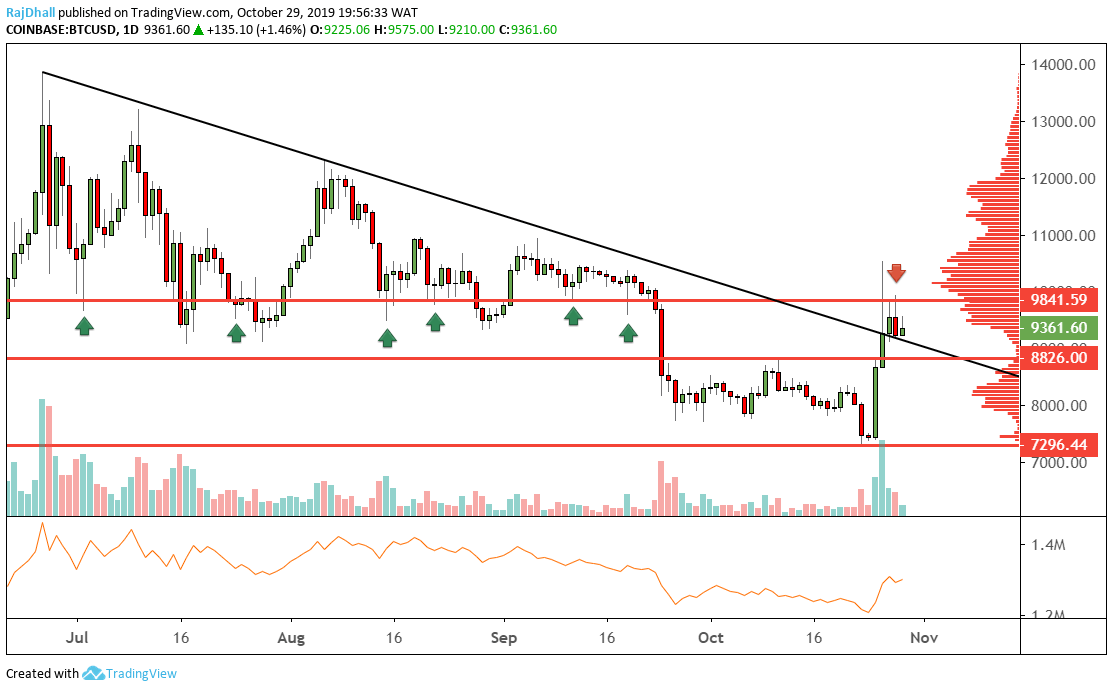
- The price now is stuck between a firm resistance level and trendline support.

On the daily price chart below I have pointed out how important the resistance zone above the price is.
There have been seven points if not more where price has reacted off the levels in this vicinity.
On Saturday, the BTC/USD price also pushed out of the trendline and is still holding above.
The good news for the bulls is that it happened on good volume, this usually means its a good break.
On the right-hand side of the chart the bell curve is showing the price rejected at the price point where most contracts were traded on the Coinbase Exchange.
Even if I use BitMEX data the area is at roughly the same point as price spent lots of time there historically.
Lastly, the On Balance Volume indicator at the bottom of the chart is showing an uptick in bullish volume.
This also shows that buying momentum is pretty strong but still under historical highs.
Author

Rajan Dhall, MSTA
FX Daily
Rajan Dhall is an experienced market analyst, who has been trading professionally since 2007 managing various funds producing exceptional returns.


