|

BTC/USD technical analysis: Bitcoin is looking for support and there is a level coming up

  • Bitcoin is weaker today after a good run over the last few days.
  • There is a key level coming up on the 4-hour chart which could provide some support.
  • In this area of selling pressure the volume has been light and during the last few bull waves decent volume was noted.
BTC/USD Chart

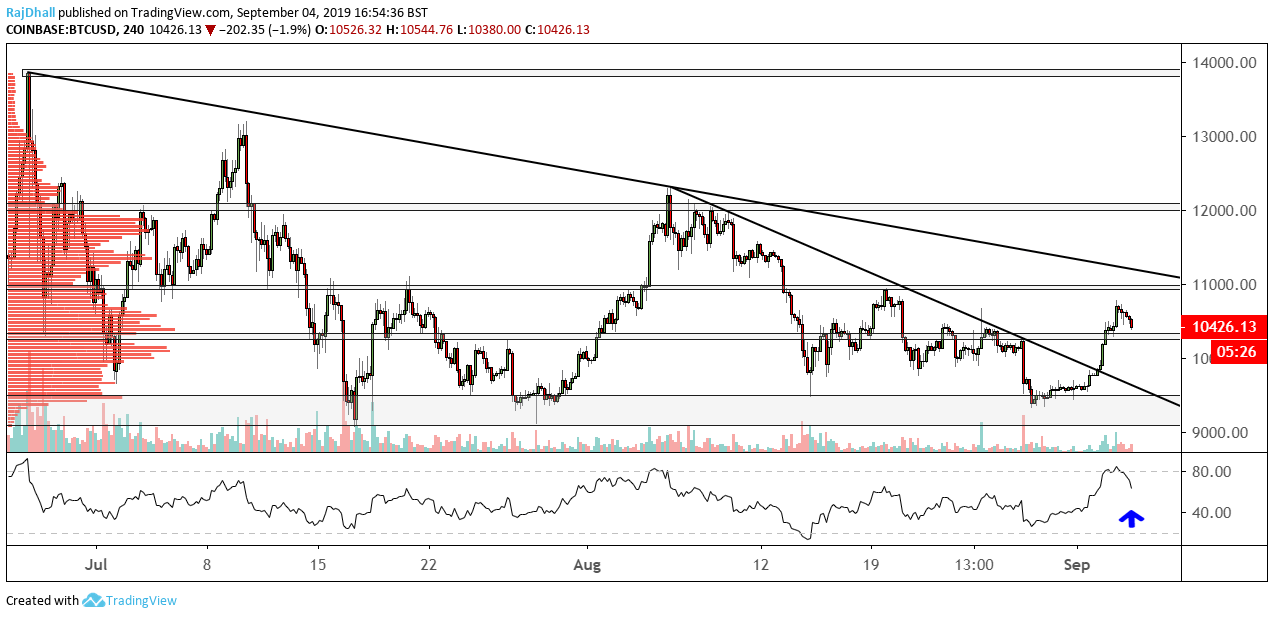
Bitcoin is looking for support on the 4-hour chart above and it might just find it at around 10,275. This intraday level of support has been used on various occasions but most notably on July 15th.

The market also sometimes front runs these levels so I wouldn't be surprised if we get some bids slightly ahead of the touted level. Another level that could be significant is the 10k psychological level. If the market manages to sell off it would be interesting to see how bulls react down there.

Another important fact about the 10,275 zone is the low volume area noted by the volume profile indicator on the left-hand side of the chart. These LVN (low volume nodes) often act as great support and resistance points on the intraday timeframes.

On the RSI indicator, I have put a little arrow to show that price is moving away from the overbought zone which could suggest the bulls ran out of steam.

Price action has been subdued today after a strong run in recent sessions. It seems there may be some profit-taking or that the market just needs a breather before another push to higher levels.

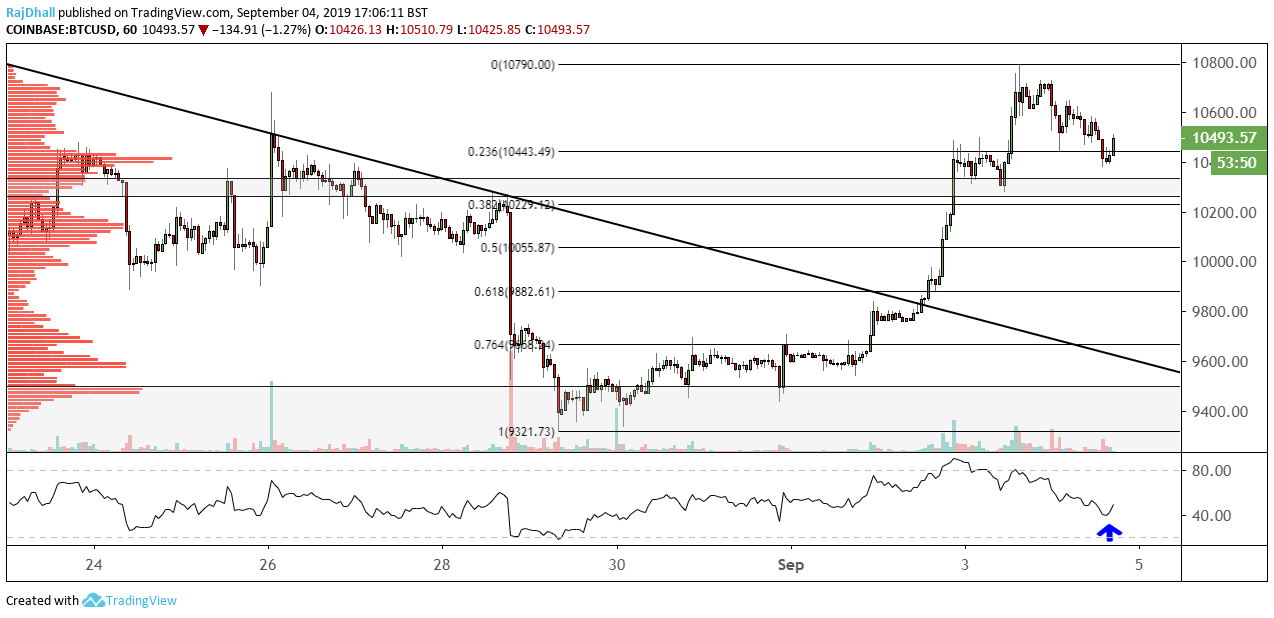
On the hourly chart below the BTC price has stalled at the 23.6% Fibonacci level but that does not mean BTC/USD is out of the woods just yet, as it could easily break lower. In terms of the Fibonacci levels on the hourly the 50% seems the strongest at 10,055.

Bitcoin hourly chart

Author

Rajan Dhall, MSTA

Rajan Dhall is an experienced market analyst, who has been trading professionally since 2007 managing various funds producing exceptional returns.

More from Rajan Dhall, MSTA
Share:

Editor's Picks

Bitcoin slips below $90,000 as Trump's tariffs swing, ETF outflows pressure price

Bitcoin price struggles below $90,000 on Friday, correcting nearly 5% so far this week. Trump’s Davos speech on Wednesday, backing away from imposing further tariffs on the EU, triggered market volatility and risk-on mood.

Ripple holds losses above $1.90 amid mild ETF inflows, muted retail interest

Ripple is trading under pressure, hovering above the immediate support level at $1.90 at the time of writing on Friday. Despite mild inflows into spot ETFs, XRP has declined for a second consecutive day, reflecting weak retail demand and persistent selling pressure.

Pump.fun sees bearish reversal despite buyback

Pump.fun trades below $0.0025 at the time of writing on Friday, after a nearly 7% decline from the 50-day Exponential Moving Average at $0.002601. The recent purchase of over $1 million in PUMP tokens failed to revive retail support, as PUMP futures continue to see capital outflow.

Crypto Today: Bitcoin, Ethereum, XRP face elevated downside risk amid weak technical setups

Bitcoin is struggling to stay above support at $89,000 at the time of writing, as headwinds intensify across the cryptocurrency market on Friday. Ethereum and Ripple are facing low retail and institutional demand, while bearish indicators continue to flash subtle signals that losses may extend further.

Bitcoin Price Annual Forecast: BTC holds long-term bullish structure heading into 2026

Bitcoin (BTC) is wrapping up 2025 as one of its most eventful years, defined by unprecedented institutional participation, major regulatory developments, and extreme price volatility.

Bitcoin: BTC slips below $90,000 as Trump's tariffs swing, ETF outflows pressure price

Bitcoin (BTC) is trading below $90,000 at the time of writing on Friday, down nearly 5% this week. Despite a brief improvement in risk appetite following US President Donald Trump’s mid-week speech at Davos, the Crypto King remains under pressure as institutional demand continued to weaken so far this week.