VanEck files for Solana ETF in the US
- VanEck filed to list a Solana spot exchange-traded fund in the US after the approval in January of Bitcoin ETFs.
- The asset manager says it considers Solana "a commodity, like Bitcoin or Ether."
- Solana jumps more than 10% following the news of the filing.

Solana (SOL) price surged by 8.2% on Thursday following the announcement of Van Eck filing the first Solana exchange-traded fund (ETF) in the US.
Matthew Sigel, the firm's head of digital assets research, announced the decision on Twitter, attaching an image of an S-1 registration form for an investment trust with the US Securities and Exchange Commission (SEC).
I am excited to announce that VanEck just filed for the FIRST Solana exchange-traded fund (ETF) in the US.
— matthew sigel, recovering CFA (@matthew_sigel) June 27, 2024
Some thoughts on why we believe SOL is a commodity are below.
Why did we file for it?
A competitor to Ethereum, Solana is open-source blockchain software designed to… pic.twitter.com/XwwPy8BXV2
Van Eck, known for filing the first Ethereum ETF in 2021, may signal a broader trend as the approval of spot Bitcoin and Ethereum ETFs potentially paves the way for more crypto ETFs in the US. Previously, the SEC had categorized SOL as a security.
“SOL’s decentralized nature, high utility, and economic feasibility align with the characteristics of other established digital commodities, reinforcing our belief that SOL may be a valuable commodity with use cases for investors, builders, and entrepreneurs looking for alternatives to the duopoly app stores,” Sigel said.
Solana trades at $147.96 at the time of writing, up more than 8.2% on Thursday.
Solana price outlook improves following ETF news
Solana price broke out of a descending channel pattern on Tuesday, rallying 8.2% on Thursday to reach $147.96, spurred by news of Van Eck filing the first Solana ETF. This channel pattern was identified using swing lows and highs between June 6 and June 25.
If SOL could close above $151.79, the daily high on June 17, then it could extend an additional 14% rally to retest its weekly resistance level at $172.93.
The Relative Strength Index (RSI) on the daily chart is rising from an oversold condition and looking to break above the mean value of 50. However, the Awesome Oscillator (AO) indicator is still below the mean zero level. If bulls are indeed making a comeback, then both momentum indicators must maintain their positions above their respective neutrality levels. This development would provide additional momentum to the ongoing recovery rally.
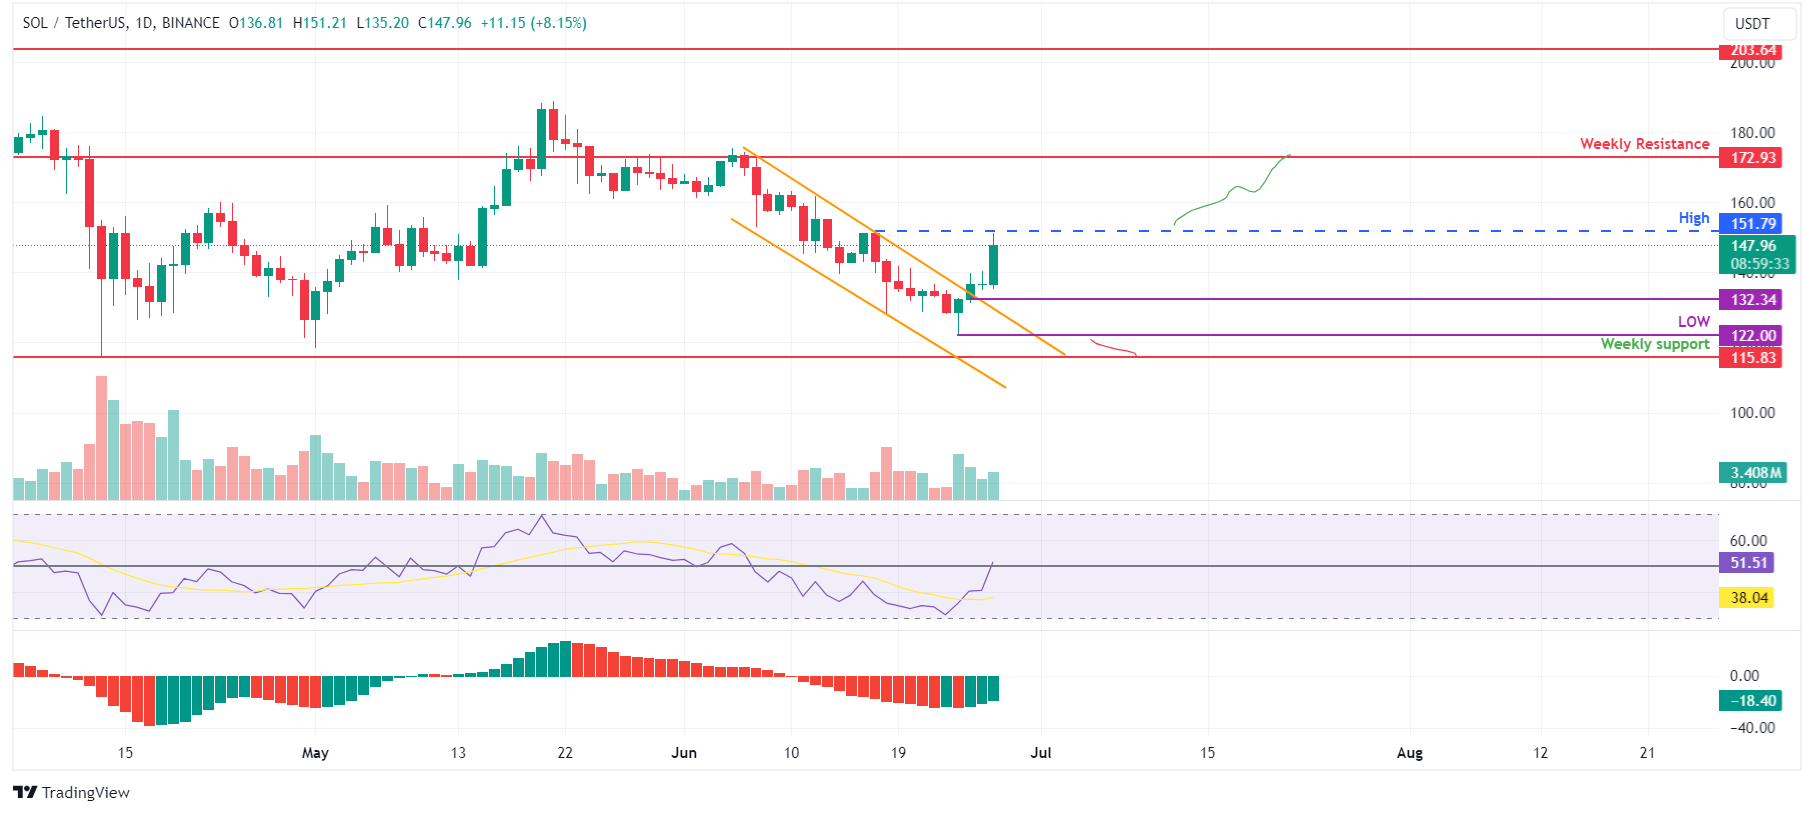
SOL/USDT daily chart
However, if Solana’s price makes a daily candlestick close below $122.00, the bullish thesis would be invalidated by creating a lower low on the daily chart. This development could see SOL's price decline by 5% to retest the weekly support level at $115.83.
Author

FXStreet Team
FXStreet
Composed of a group of economic journalists and FX experts, the FXStreet content team produces and oversees all content published on FXStreet. It provides a purely journalistic approach to the Forex market.



