Solana price poised for a 10% rally
- Solana price breaks out of the descending channel pattern, signaling a bullish move.
- Sideline buyers can accumulate SOL at the trendline retest level of around $132.34.
- A daily candlestick close below $122.00 would invalidate the bullish thesis.
Solana's price has broken out from the descending channel pattern on Tuesday and currently trades 3.5% above the breakout point. Investors on the sidelines seeking entry points can consider buying near the trendline retest level around $132.34 before the bulls follow through on SOL price in the upcoming days.
Solana price breaks above the descending channel
Solana price surged above the descending channel pattern on Tuesday and is now 3.5% higher from the breakout point on Thursday, reaching $137.31.This descending channel pattern is drawn from joining multiple swing lows and highs from June 6 to June 25.
If this upper band of the descending trendline around $132.34 holds as throwback support, SOL could rally 10% to retest its June 17 daily high of $151.79.
The Relative Strength Index (RSI) on the daily chart is rising from an oversold condition and looking to break above the mean value of 50. However, the Awesome Oscillator (AO) indicator is still below the mean zero level. If bulls are indeed making a comeback, then both momentum indicators must maintain their positions above their respective neutrality levels. This development would provide additional momentum to the ongoing recovery rally.
If the bulls are aggressive, and the overall crypto market outlook is positive, SOL could close above $151.79 and even extend an additional 14% rally to retest its weekly resistance level at $172.93.
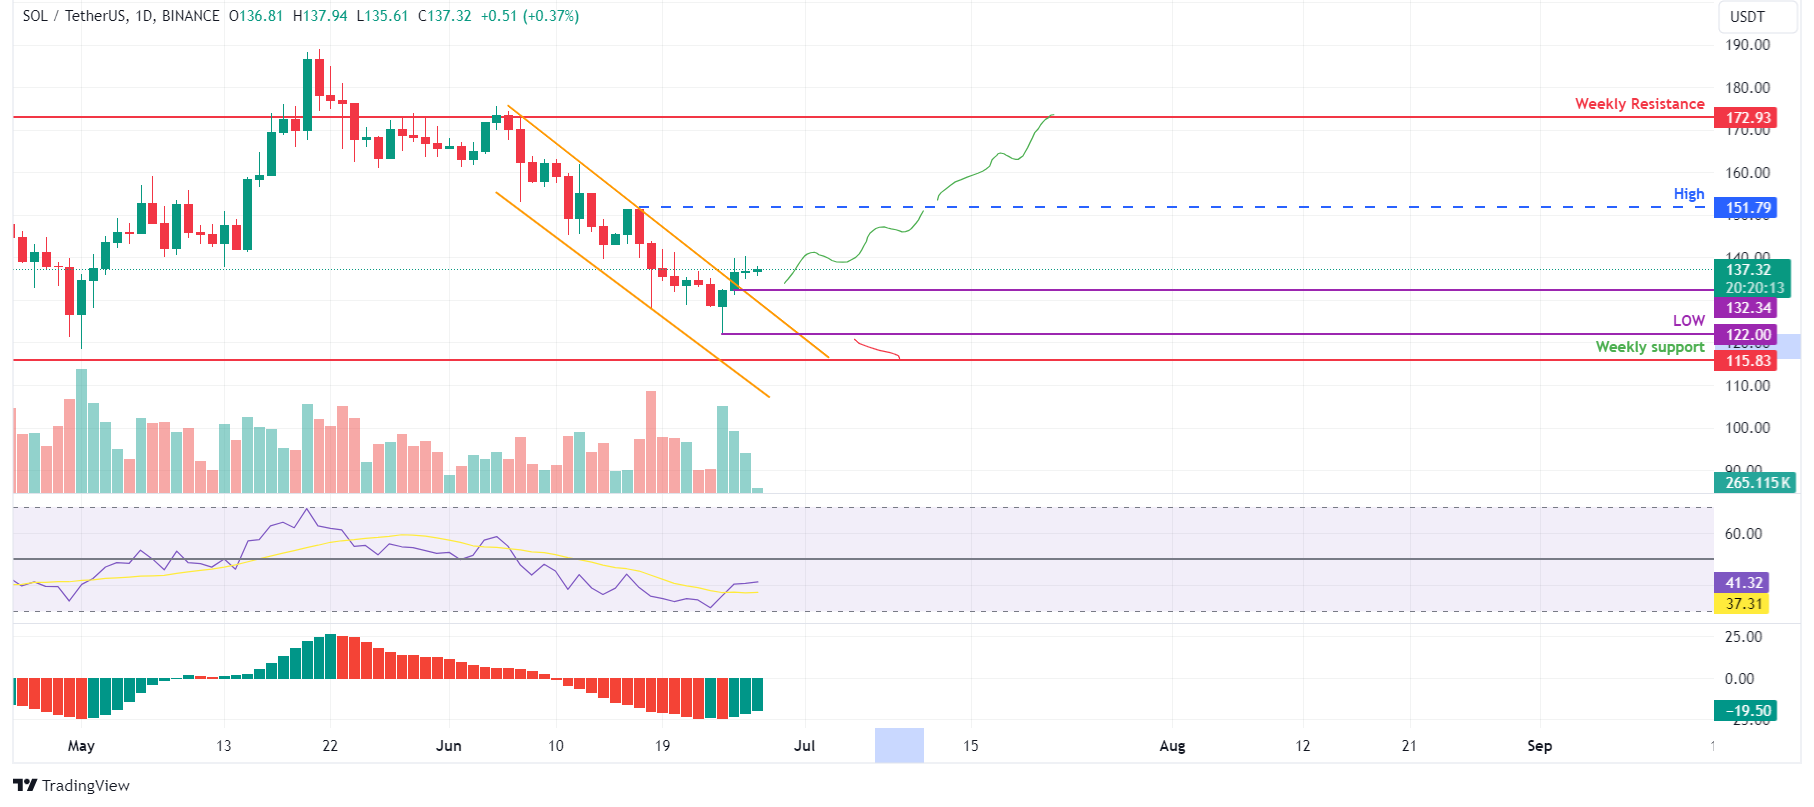
SOL/USDT daily chart
However, if Solana’s price makes a daily candlestick close below $122.00, the bullish thesis would be invalidated by creating a lower low on the daily chart. This development could see SOL's price decline by 5% to retest the weekly support level at $115.83.
Author

Manish Chhetri
FXStreet
Manish Chhetri is a crypto specialist with over four years of experience in the cryptocurrency industry.


