Bonk Price Forecast: BONK extends fragile technical outlook
- Bonk struggles to hold $0.000020 underpinned by a strong bearish grip.
- Multiple sell signals keep Bonk price suppressed below the 50-day, 100-day and 200-day EMAs.
- Bonk faces a deteriorating funding rate and Open Interest, exacerbating risk-averse sentiment.

Bonk (BONK), a Solana-based meme, offers recovery signs, up 2% on Tuesday and marking a knee-jerk bounce after extending its downtrend below the critical $0.000020 level. The token peaked at around $0.000040 in July, marking a local top.
Bonk upside-heavy mirrors weak derivatives market
Bonk has sustained an overall downtrend since its July local top, with recovery attempts becoming increasingly difficult to sustain. A glance at the derivatives market’s Open Interest (OI), which represents the value of outstanding futures or options contracts, highlights a sticky risk-averse sentiment.
According to CoinGlass data, OI overages at $28 million at the time of writing, down from approximately $73 million observed in July. The persistent decline suggests low market sentiment amid decreased trading activity, which could keep upward price movement suppressed in the coming days.
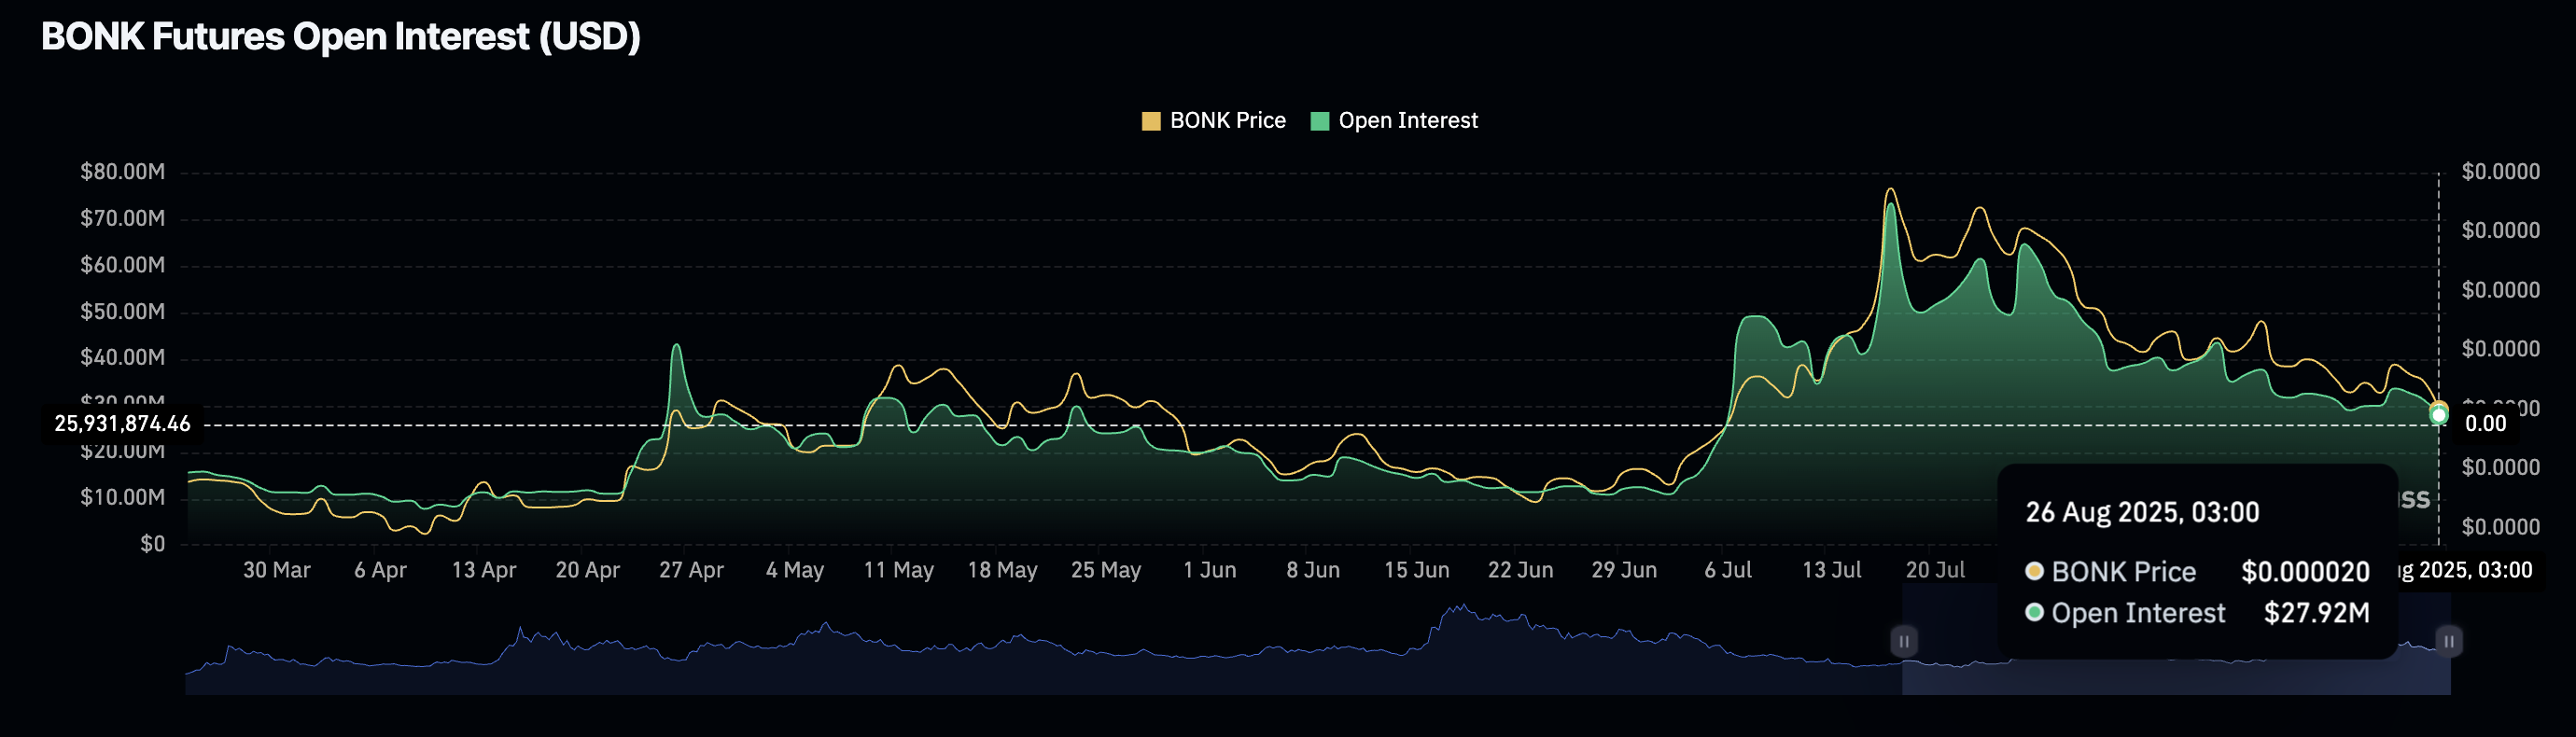
Bonk Futures Open Interest | Source: CoinGlass
A subsequent correction in the futures funding rate to 0.0018% corroborates the bearish sentiment. Low funding rates imply that fewer traders are leveraging long positions in Bonk. This lack of conviction among traders could hinder price recovery in the short term.
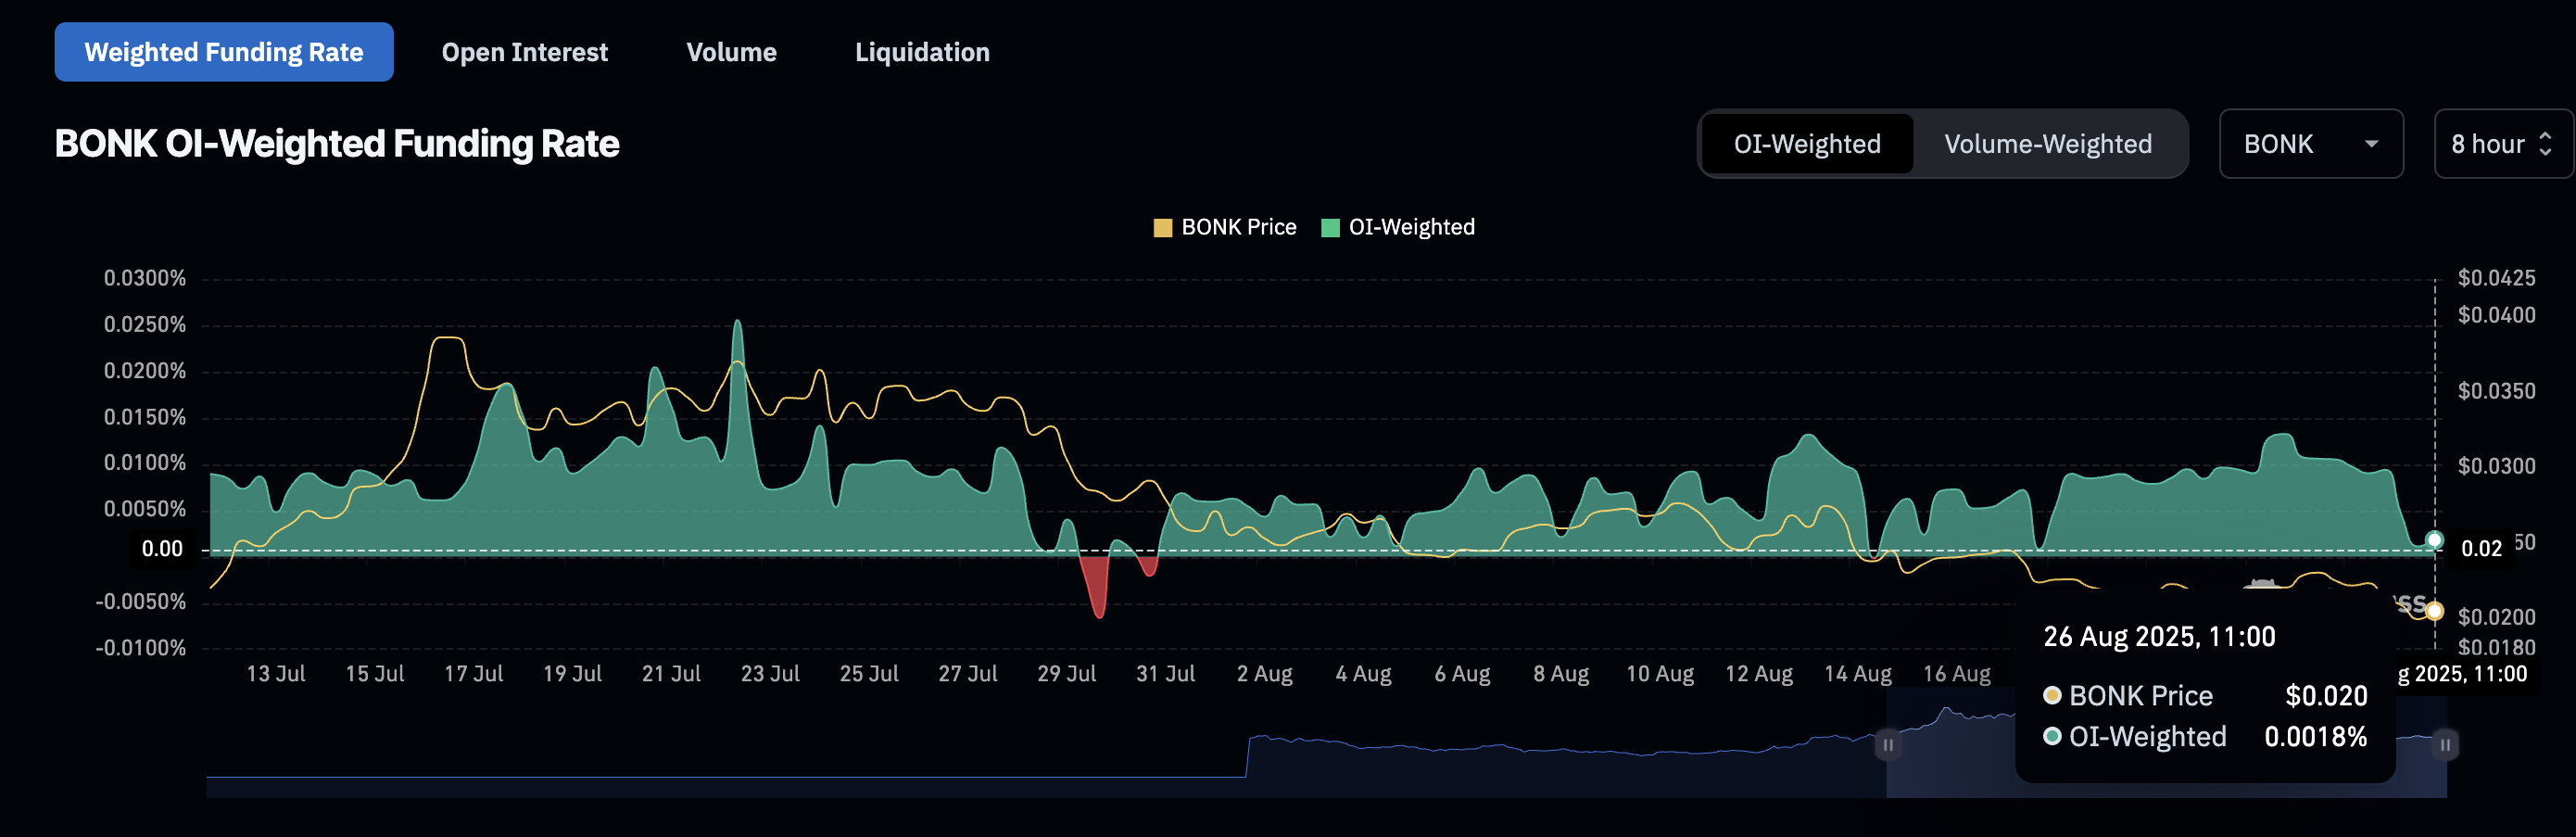
Bonk Futures Weighted Funding Rate | Source: CoinGlass
Technical outlook: Bonk holds above key support
Bonk price holds above the short-term support at $0.000020, which coincides with a descending channel’s middle boundary. Despite printing the first green candle following three consecutive days of declines, multiple technical indicators display bearish signals.
The Moving Average Convergence Divergence (MACD) indicator backs the bearish grip with a sell signal on July 27. If the downtrend persists and the blue MACD line remains below the red signal line, investors could reduce exposure and exacerbate bearish sentiment.
The SuperTrend indicator also dons a sell signal maintained since August 1. This trend-following tool serves as dynamic resistance until it flips below the Bonk price, triggering a buy signal.
Although the Relative Strength Index (RSI) holds in the bearish region, it is not yet oversold, which means traders have room to extend their bearish influence on the meme coin.
Reduced buying pressure could hinder Bonk from extending recovery above $0.000020. Beyond this key level, Bonk could shift focus to lower support zones such as $0.000015, tested on May 31 and $0.000011, tested on June 22.
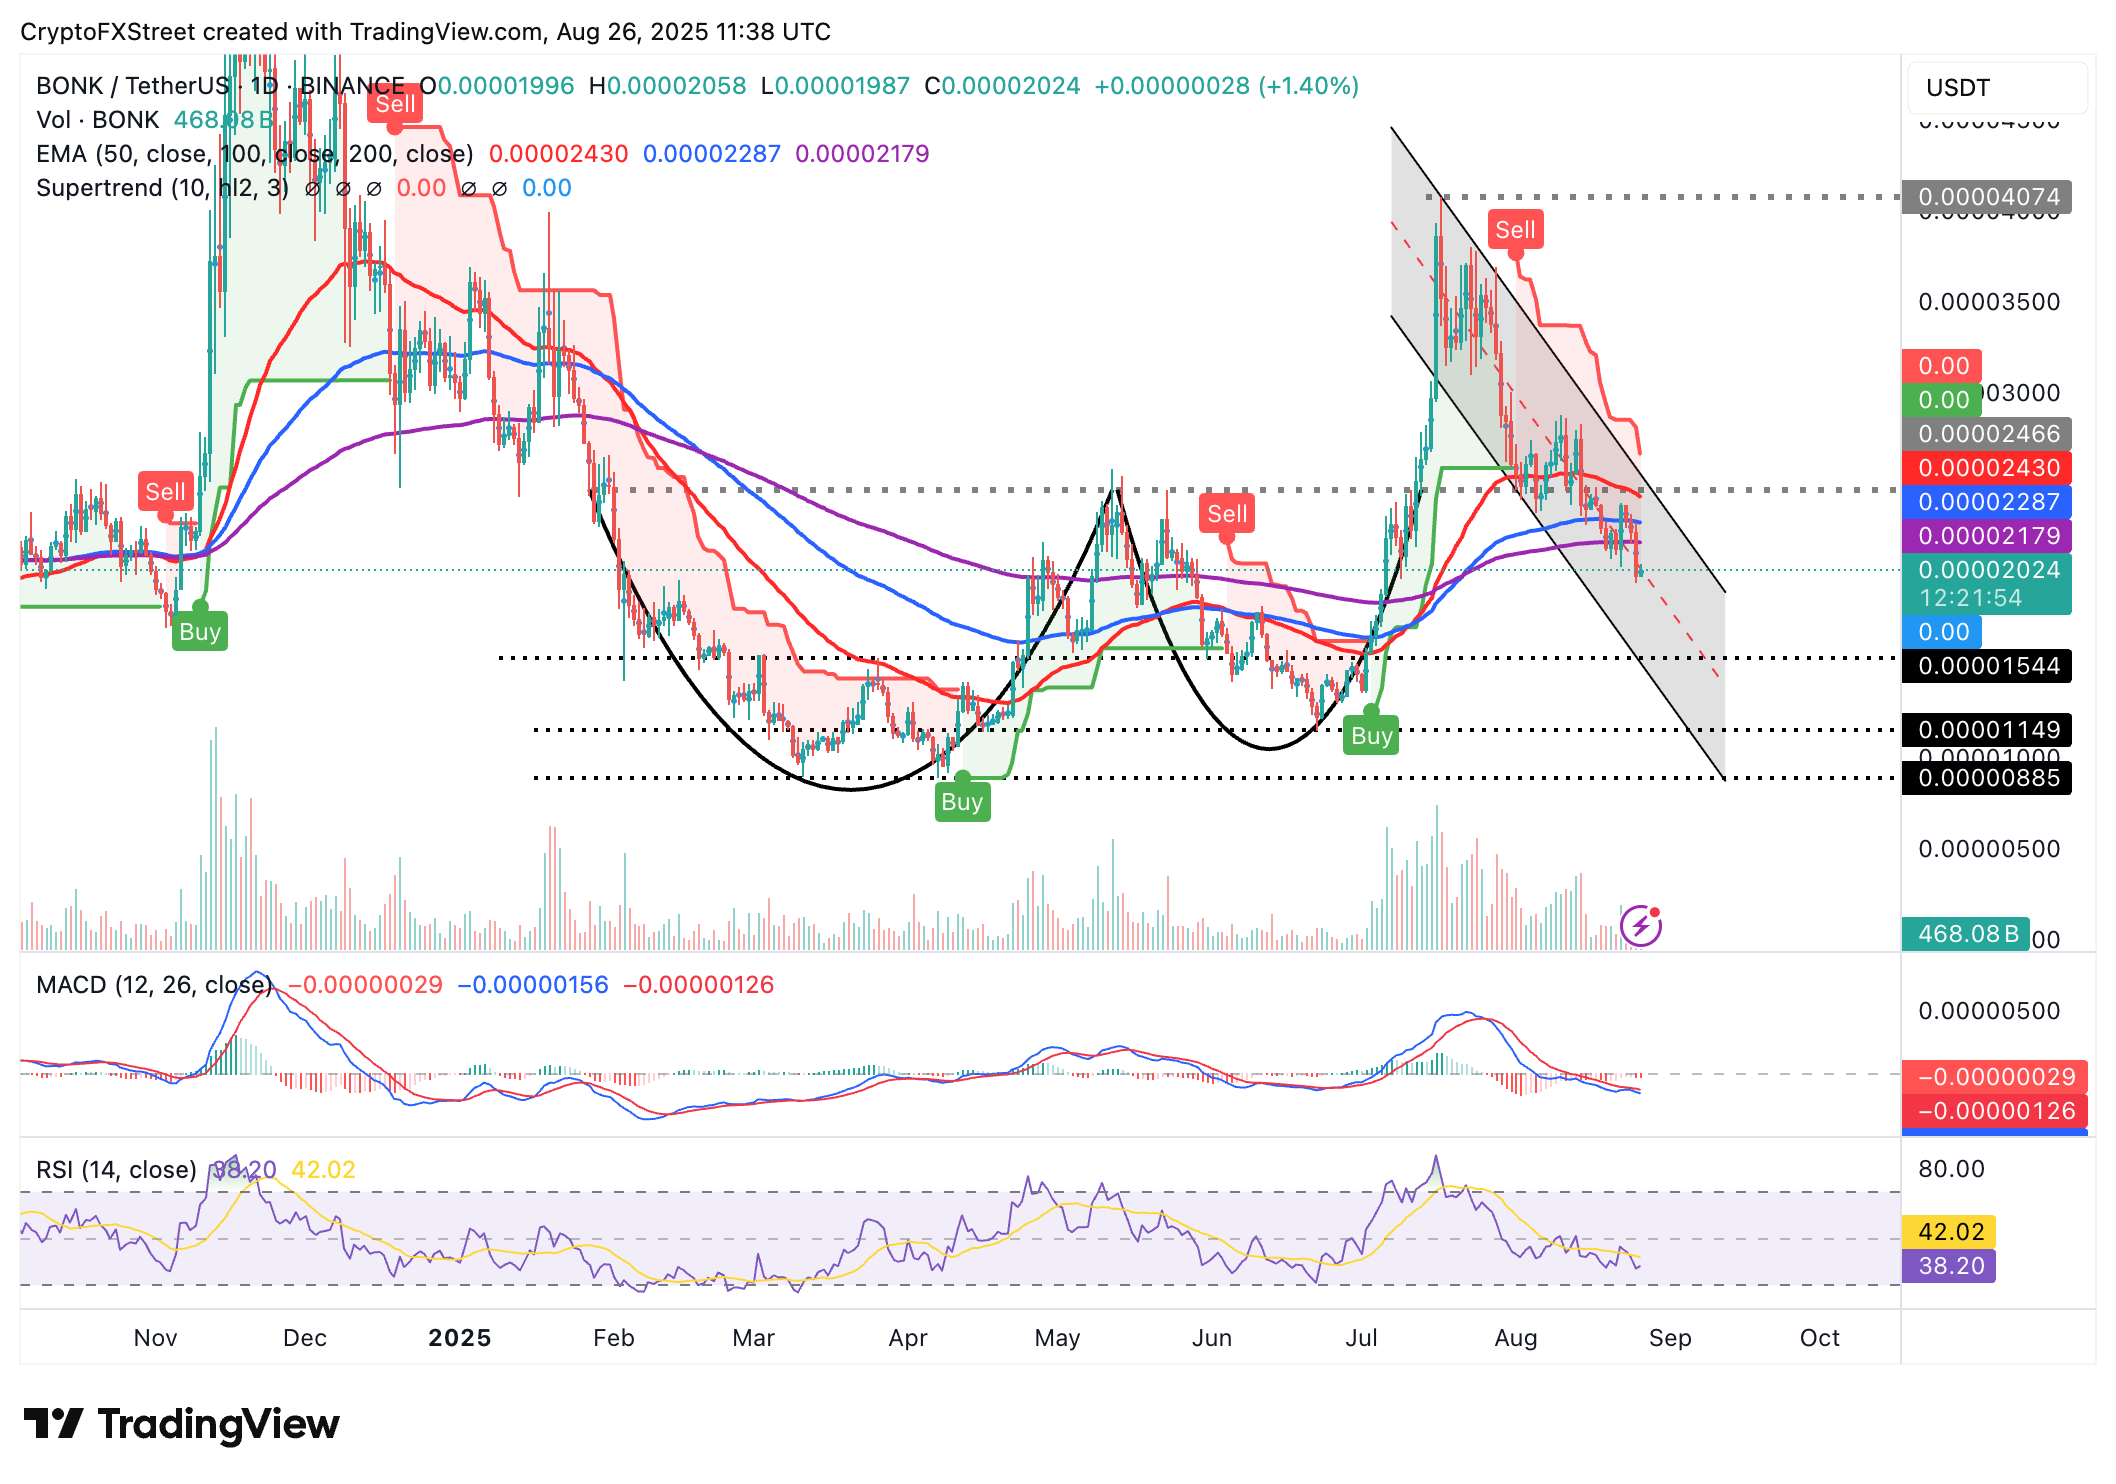
BONK/USDT daily chart
Still, Bonk’s position below the 200-day Exponential Moving Average (EMA) at $0.000021, the 100-day EMA at $0.000022 and the 50-day EMA at $0.000024 puts bulls at a disadvantage amid weak market sentiment. These levels could also hinder the resumption of the uptrend toward Bonk’s July peak of $0.000040.
Bitcoin, altcoins, stablecoins FAQs
Bitcoin is the largest cryptocurrency by market capitalization, a virtual currency designed to serve as money. This form of payment cannot be controlled by any one person, group, or entity, which eliminates the need for third-party participation during financial transactions.
Altcoins are any cryptocurrency apart from Bitcoin, but some also regard Ethereum as a non-altcoin because it is from these two cryptocurrencies that forking happens. If this is true, then Litecoin is the first altcoin, forked from the Bitcoin protocol and, therefore, an “improved” version of it.
Stablecoins are cryptocurrencies designed to have a stable price, with their value backed by a reserve of the asset it represents. To achieve this, the value of any one stablecoin is pegged to a commodity or financial instrument, such as the US Dollar (USD), with its supply regulated by an algorithm or demand. The main goal of stablecoins is to provide an on/off-ramp for investors willing to trade and invest in cryptocurrencies. Stablecoins also allow investors to store value since cryptocurrencies, in general, are subject to volatility.
Bitcoin dominance is the ratio of Bitcoin's market capitalization to the total market capitalization of all cryptocurrencies combined. It provides a clear picture of Bitcoin’s interest among investors. A high BTC dominance typically happens before and during a bull run, in which investors resort to investing in relatively stable and high market capitalization cryptocurrency like Bitcoin. A drop in BTC dominance usually means that investors are moving their capital and/or profits to altcoins in a quest for higher returns, which usually triggers an explosion of altcoin rallies.
Author

John Isige
FXStreet
John Isige is a seasoned cryptocurrency journalist and markets analyst committed to delivering high-quality, actionable insights tailored to traders, investors, and crypto enthusiasts. He enjoys deep dives into emerging Web3 tren


