Solana Price Analysis: Risks deepen as SOL retraces under $200 with bearish signals
- Solana retraced under the $200 mark, falling 9% on Monday, with bears targeting a five-month support trendline.
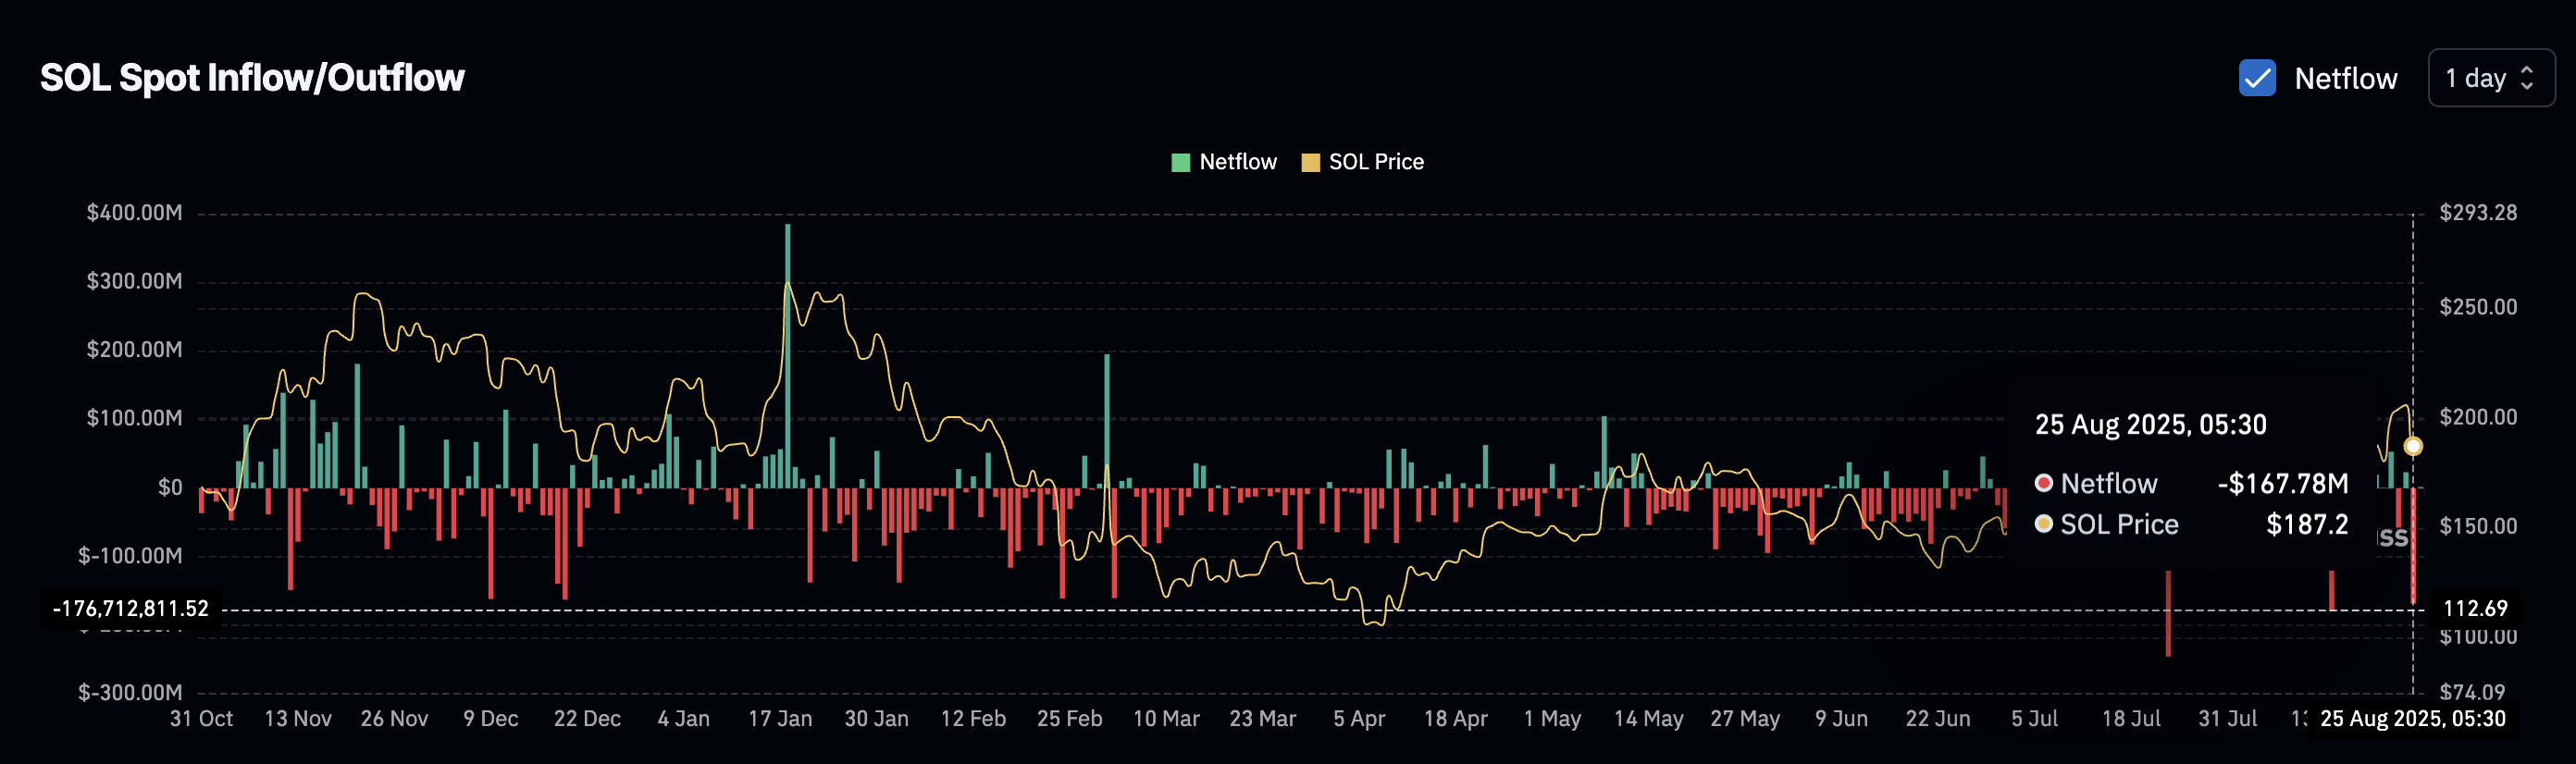
- The net outflow marked the third-highest level of the year on Monday.
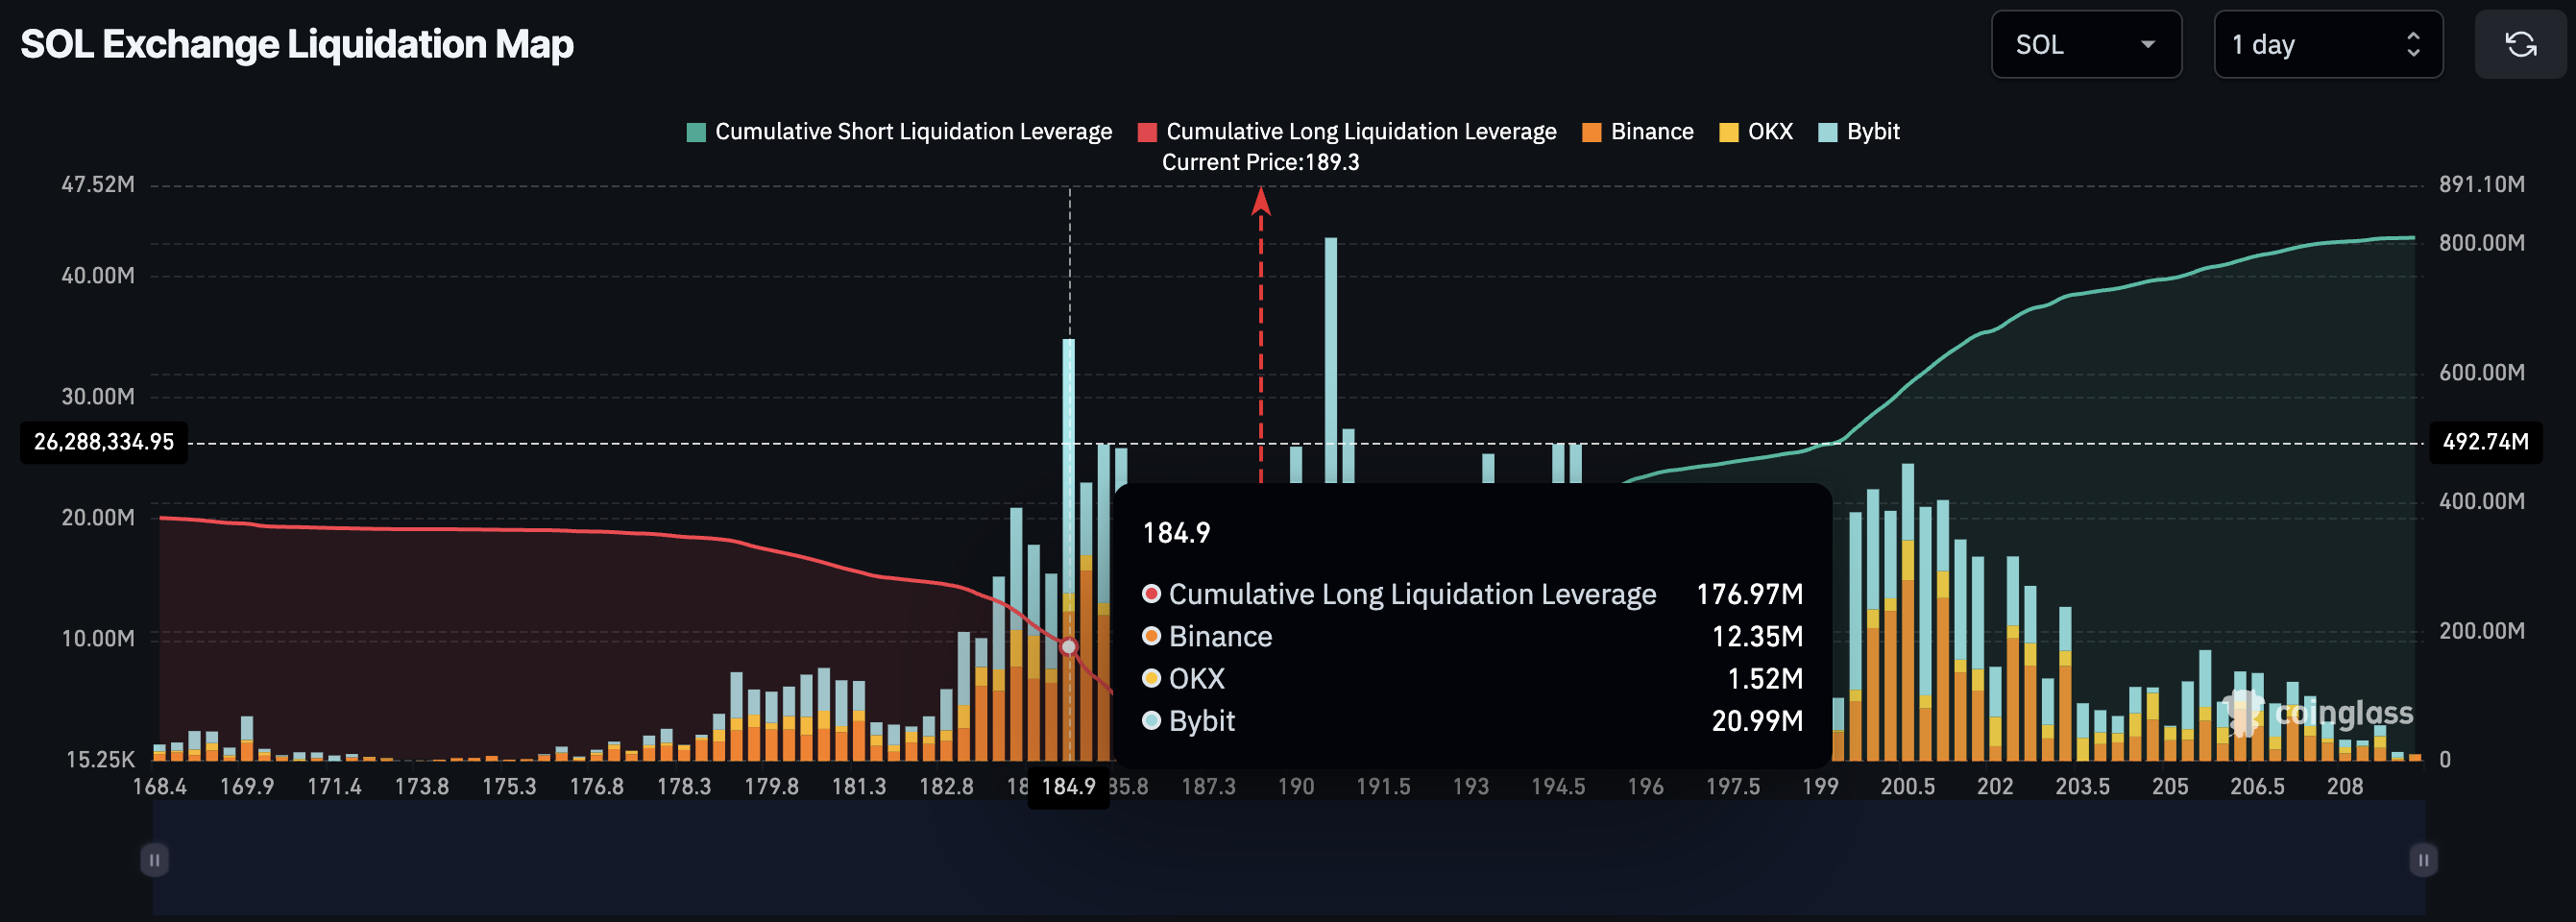
- The liquidation map highlights a risk of $176 million in long liquidations.

Solana (SOL) edges higher by nearly 0.50% at press time on Tuesday, succeeding the 9.12% drop on Monday. The sudden fall in SOL is underpinned by massive net outflow, which is now flashing a risk of $176 million in long liquidations if the declining trend continues.
Rising liquidation risks a bearish spiral
CoinGlass data shows the Solana net outflow of $167.78 million on Monday as the collapsing spot price fueled liquidations and forced traders to withdraw tokens. The sharp increase in net outflow reached its third-highest level in 2025, following the July 23 and August 14 flash crashes.
If SOL's decline drops below $185, the liquidation map projects the possibility of $176 million in cumulative long liquidation leverage. Looking up, a $102 million cumulative short liquidations leverage is at risk if SOL reclaims the $190 mark.
Solana risks testing the 50-day EMA
Solana is currently holding at $188 at the time of writing, presenting a Doji-shaped candle on the daily chart. The sixth-largest cryptocurrency by market capitalization, SOL, with a value of $102 billion, is currently on a path of least resistance towards the 50-day Exponential Moving Average (EMA) at $179.
The momentum indicators display mixed, neutral-to-bearish signals on the daily chart. The Moving Average Convergence Divergence (MACD) approaches its signal line, teasing a potential crossover that will flash a sell signal as the trend reversal shifts bearish. Still, the recent short-lived crossovers reflect the uncertainty in the SOL price trend.
The Relative Strength Index (RSI) reads 51 on the daily chart, approaching the halfway line, which represents neutrality in the momentum. However, a drop below this level would indicate a sell-side dominance in the trading activity.
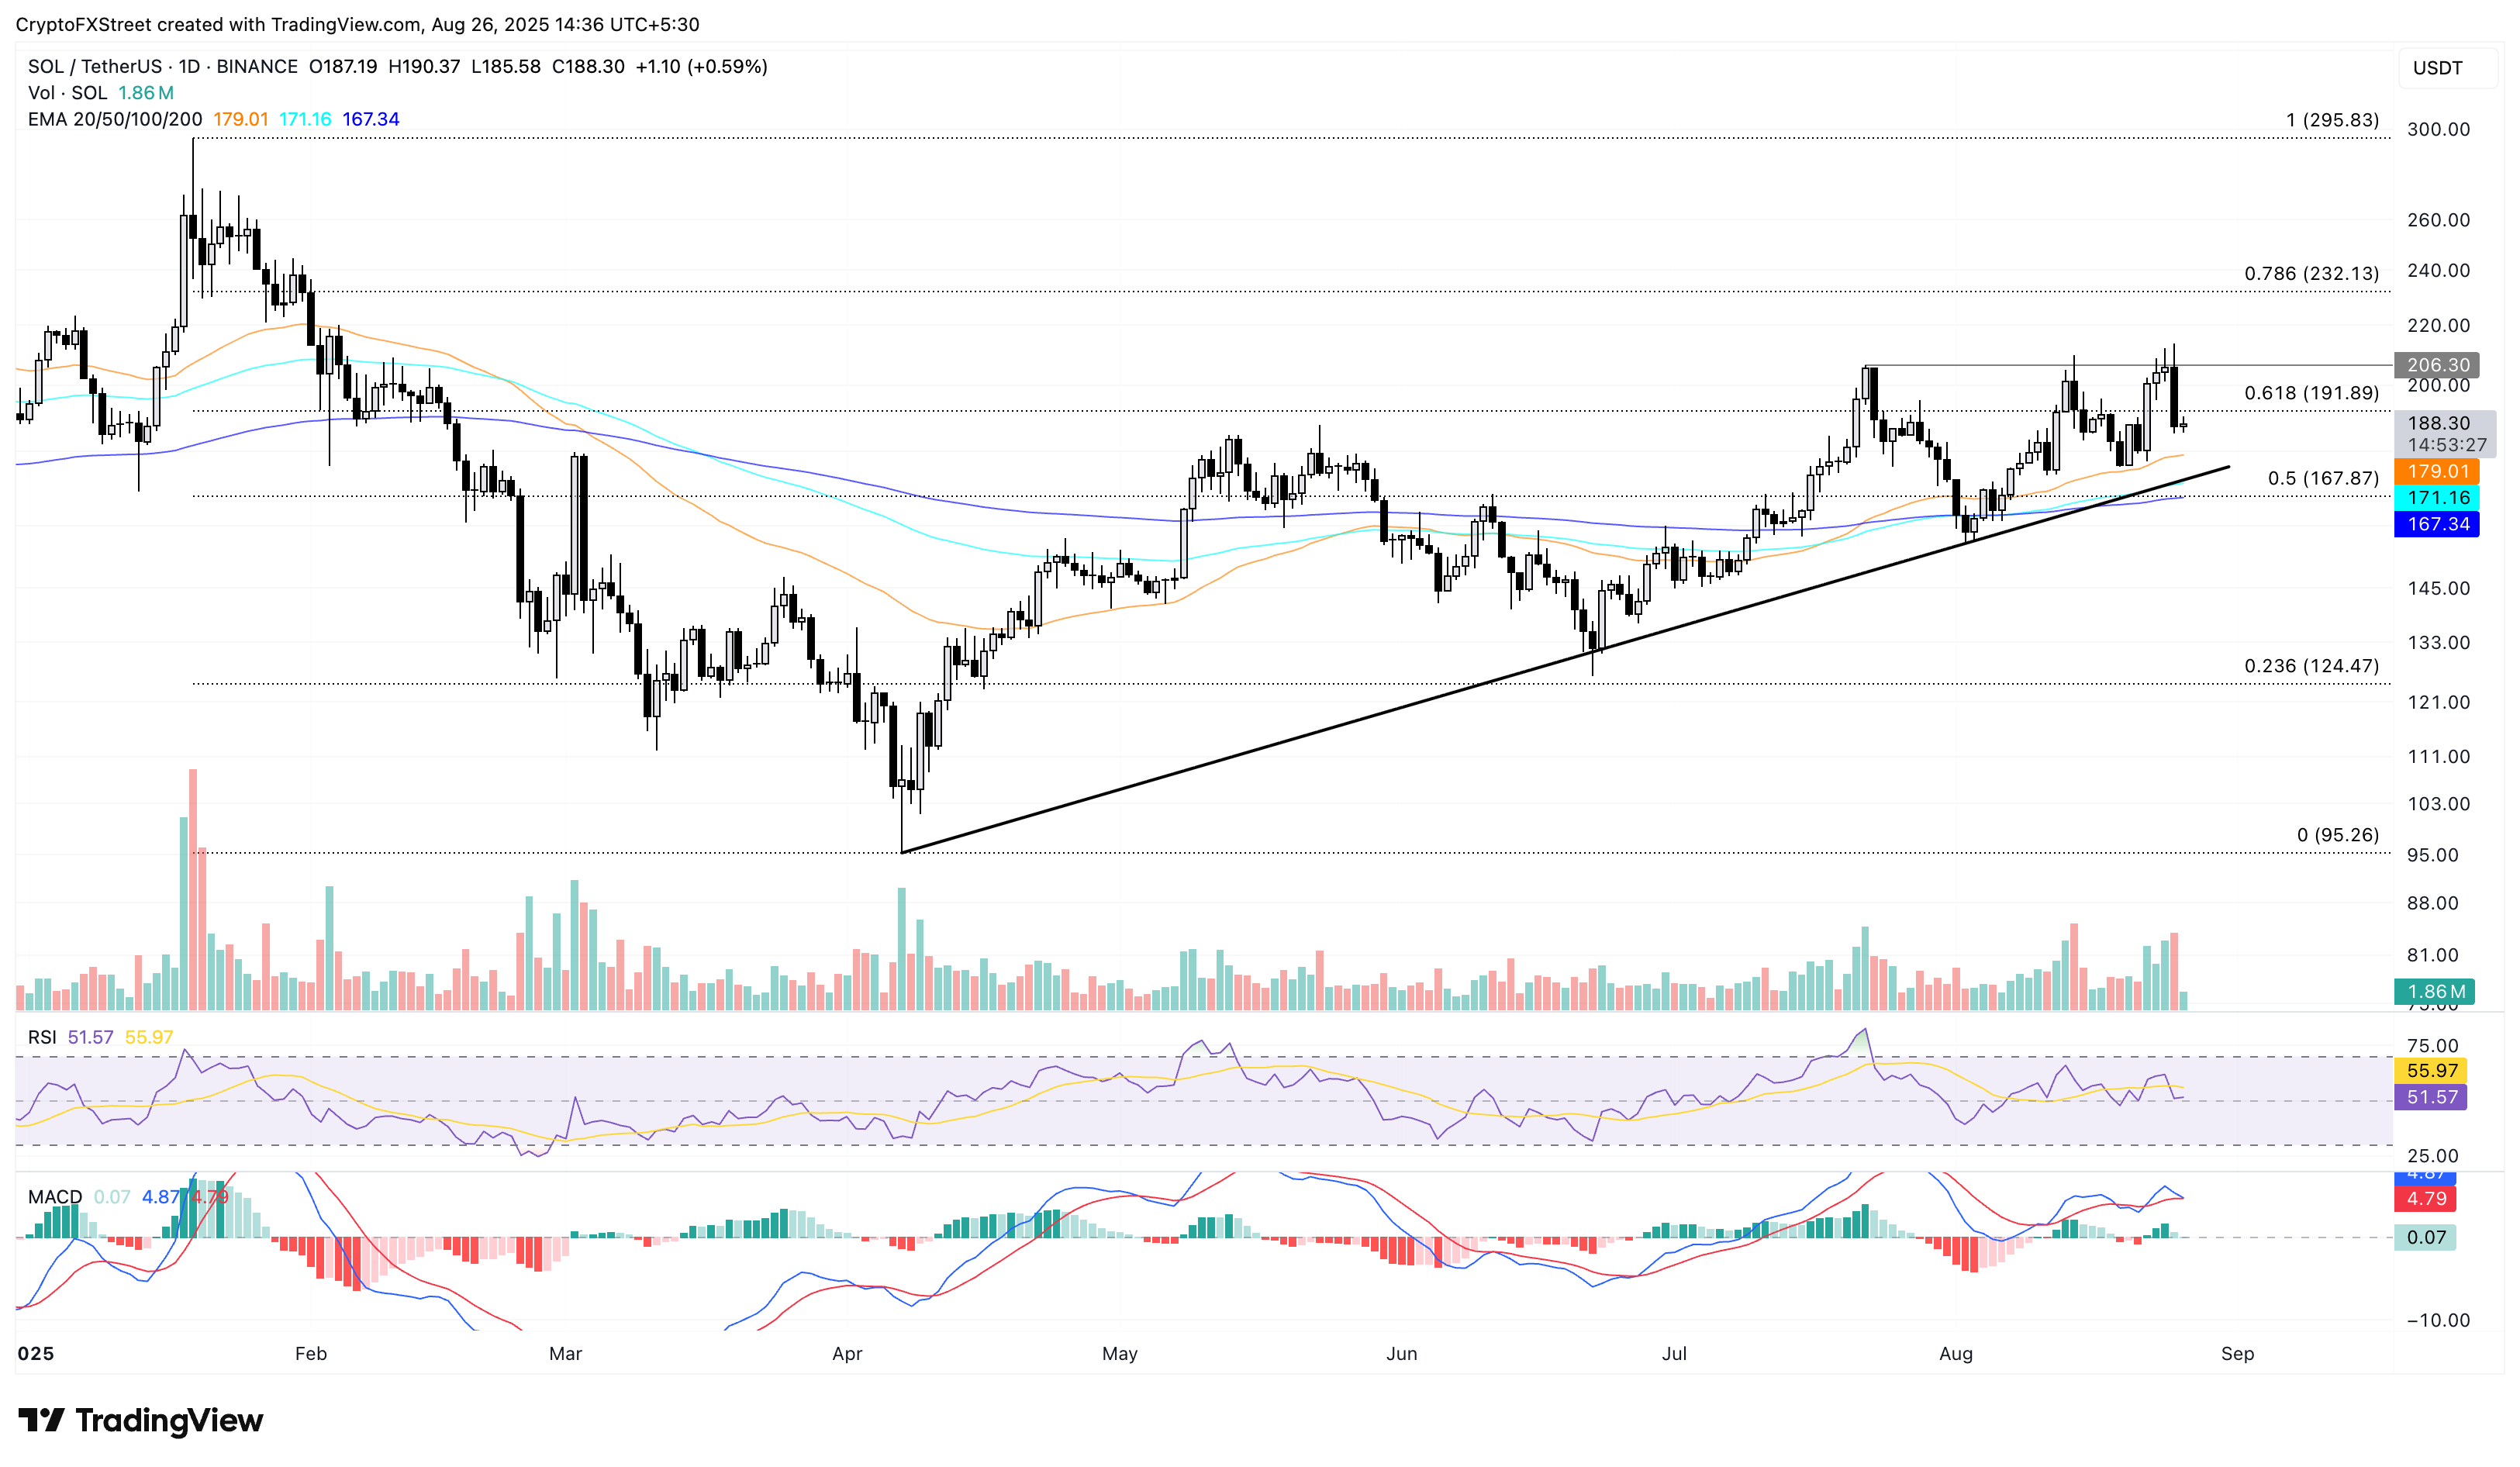
SOL/USDT daily price chart.
Looking up, Solana should surpass the July 22 high of $206 resistance level to target $232, aligning with the 78.6% Fibonacci retracement level drawn from the $295 high from January 19 to the $95 low from April 7.
Author

Vishal Dixit
FXStreet
Vishal Dixit holds a B.Sc. in Chemistry from Wilson College but found his true calling in the world of crypto.