Bitcoin's price to follow the hash rate increase if the history is any guide
- Bitcoin's price may follow the lead of the hash rate.
- BTC/USD needs to regain ground above SMA200 daily.

Bitcoin hit the highest level of 2020 at $9,184 on Sunday and retreated to $8,638 by the time of writing. The first digital asset has lost 4.6% of its value in recent 24 hours and stayed unchanged since the beginning of the day as the market calmed down after the weekend volatility.
Bitcoin's hash rate reached an all-time high. Again.
At the end of the previous week, Bitcoin's hash rate reached 126 exahash per second (EH/s), which is the highest level on record. It means that Bitcoin miners need to put more computing power at any given time to "discover" answers to the cryptographic puzzles. The figure of 126 exahash per second means that miners need to go through 126,000,000,000,000,000,000 guesses (hashes) per second before they find an answer.
A rising hash rate is considered a good signal as more miners join the network and make it more secure and hack-resistant. Thus, it is indicative of growing miners' interest. According to Max Keiser, that calls himself a tweet poet, there is a direct correlation between the price and the hash rate:
Price follows hash rate and hash rate chart continues its 9 yr bull market.
Thus, the recovery in 2019 after the price hit bottom in December 2018 was predicted by the changes in the hash rate. However, it may take some time before the price catches up with the hash rate.
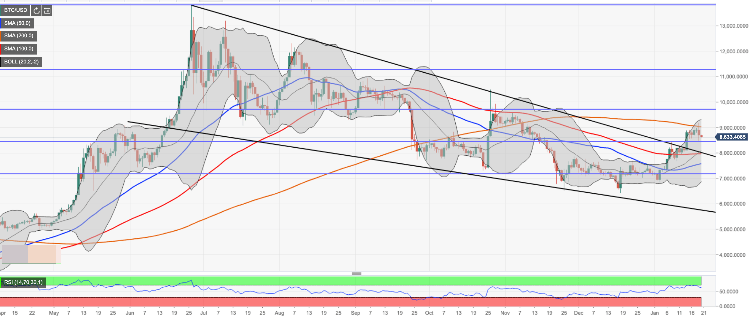
BTC/USD: technical picture
Bitcoin's recovery is still effectively capped by SMA200 daily at $9,027. The price will need a sustainable move above this pivotal resistance for the upside to gain traction and take it to the recent high of $9,184. The next strong barrier is created by the upper line of the daily Bollinger Band at $9,300 and 38.2% Fibo retracement of the upside move from December 2018 low to July 2019 high. This area is likely to slow down the recovery and trigger a short-term correction.
On the downside, BTC will need to stay above $8,500 to retain the bullish bias. If this support area is sustainably broken, the sell-off pressure will intensify with the next bearish aim at a psychological $8,000 reinforced by the broken upper boundary of the wedge formation.
BTC/USD daily chart
Author

Tanya Abrosimova
Independent Analyst


