Bitcoin’s corrective period may last until January 2021 as BTC whales continue to realize profits
- Bitcoin is treading on shaky grounds, with supply intensifying as whales realize profits.
- The Bitcoin SOPR metric suggests that correction will continue until all the whales selling take all their profits.
- BTC/USD has suffered another rejection from $19,500 and is currently seeking support at $19,000.

Bitcoin has recently reclaimed the position above $19,000 and even extended the price action towards $19,500. However, a reversal seems imminent according to key on-chain metrics, which call for caution in the coming few weeks.
Overhead pressure on Bitcoin intensifies as whales realize profits
Glassnode’s on-chain metrics have gradually become relevant to both day traders and long-term investors like the Spent Output Profit Ratio (SOPR), calculated from spent outputs. It is precisely “the realized value (USD) divided by the value at creation (USD) of the output.” In other words, it is the price sold divided by the price paid.
At any instance, when the SOPR is greater the one, it means that the holders of spent outputs realize profits. It also implies that when it is less than one, they are at a loss. The SOPR was developed by Renato Shirakashi and is said to be a reliable tool for identifying local tops and bottoms.
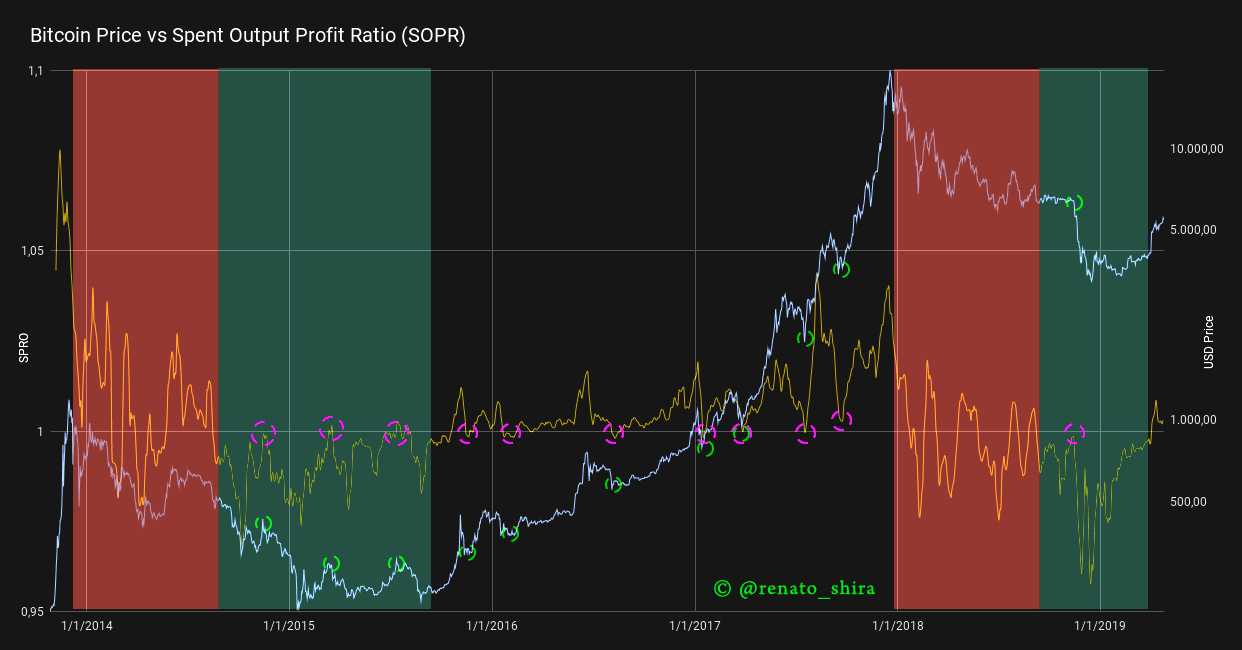
Bitcoin SOPR chart
According to the prevailing SOPR chart, holders of spent outputs started to realize profits several weeks back. This means that these whales are looking to sell and make profits before beginning to explore new highs.
In other words, Bitcoin is poised for a considerable retreat before a rebound occurs. As mentioned, it is time to exercise caution until the flagship cryptocurrency renews the momentum to push for new all-time highs.
Note that all investors currently in profit will not sell. However, it is advisable to wait until all those that plan to sell do so. As the selling pressure goes down, the SOPR value will retreat to one and signal more investors to come in (the estimated time is around January).
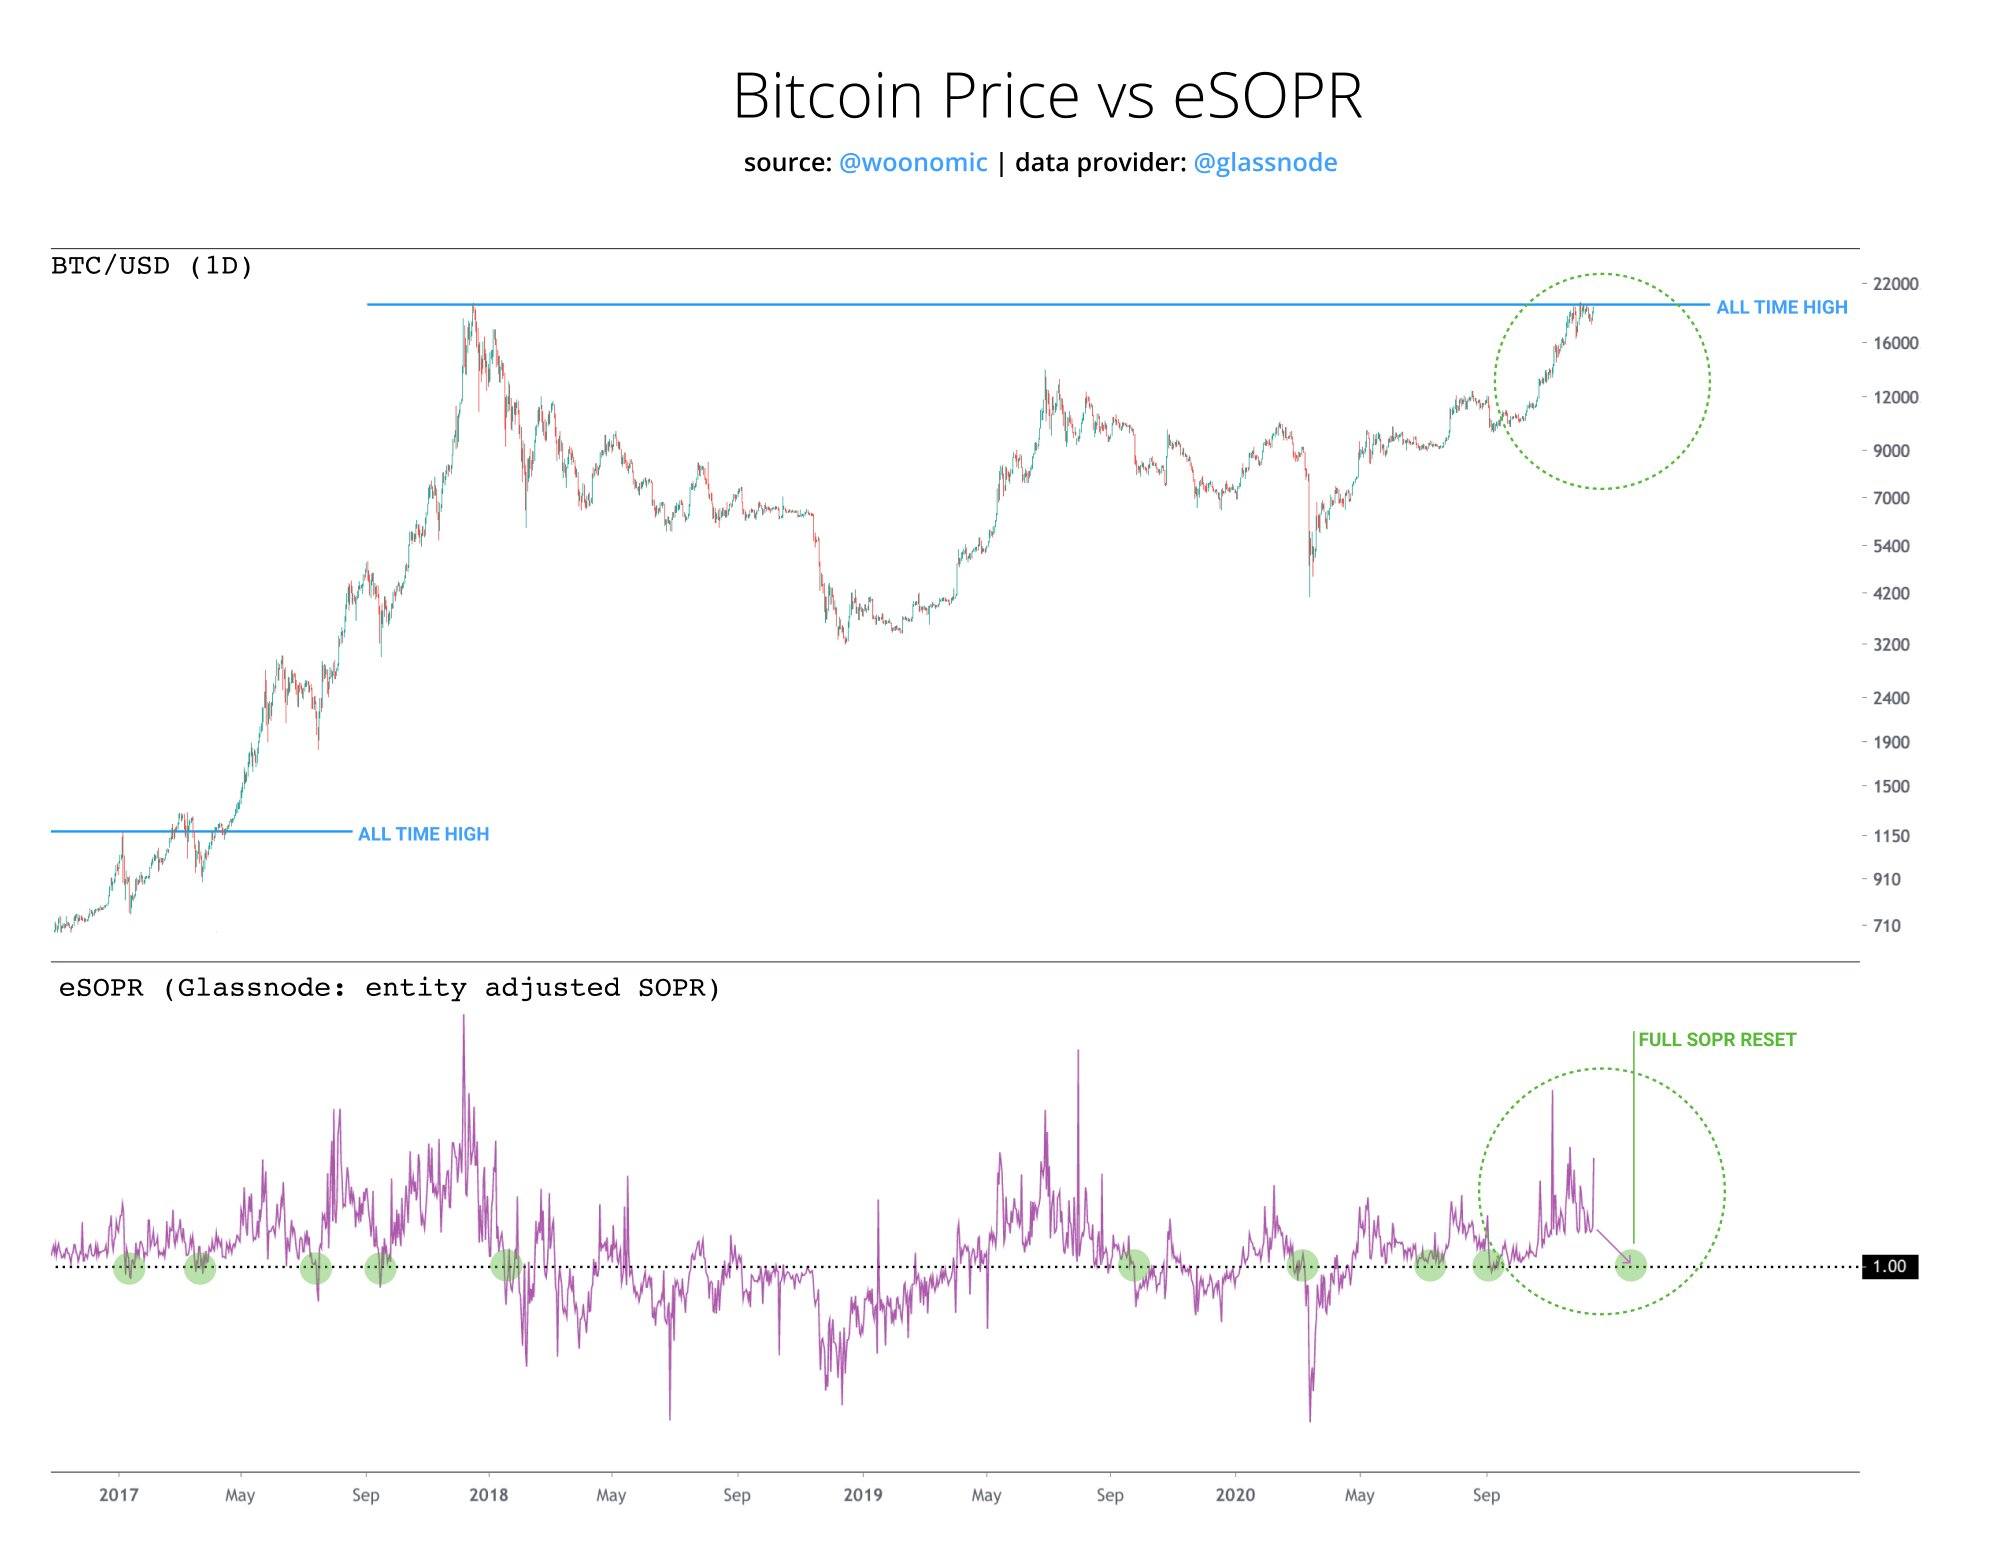
Bitcoin SOPR chart
It is worth noting that the SOPR could also refuse to reset to one or a lesser figure. A couple of reasons have been used to explain this scenario (evident in the 2017 bull run).
The first is the fear of missing out (FOMO) kicking in and buying pressure rising above the profit-taking pressure. In this case, the SOPR will continue to grow and is advisable to buy in, but still with caution because this occurrence usually takes place in the last phases of a bull run.
The second is that even older people (your grandma maybe) start giving financial advice to buy BTC. This stage is referred to as the ‘mania phase of the market). In this stage, even the Uber driver will be calling out to you to buy Bitcoin, perhaps claiming to work for a crypto hedge fund.
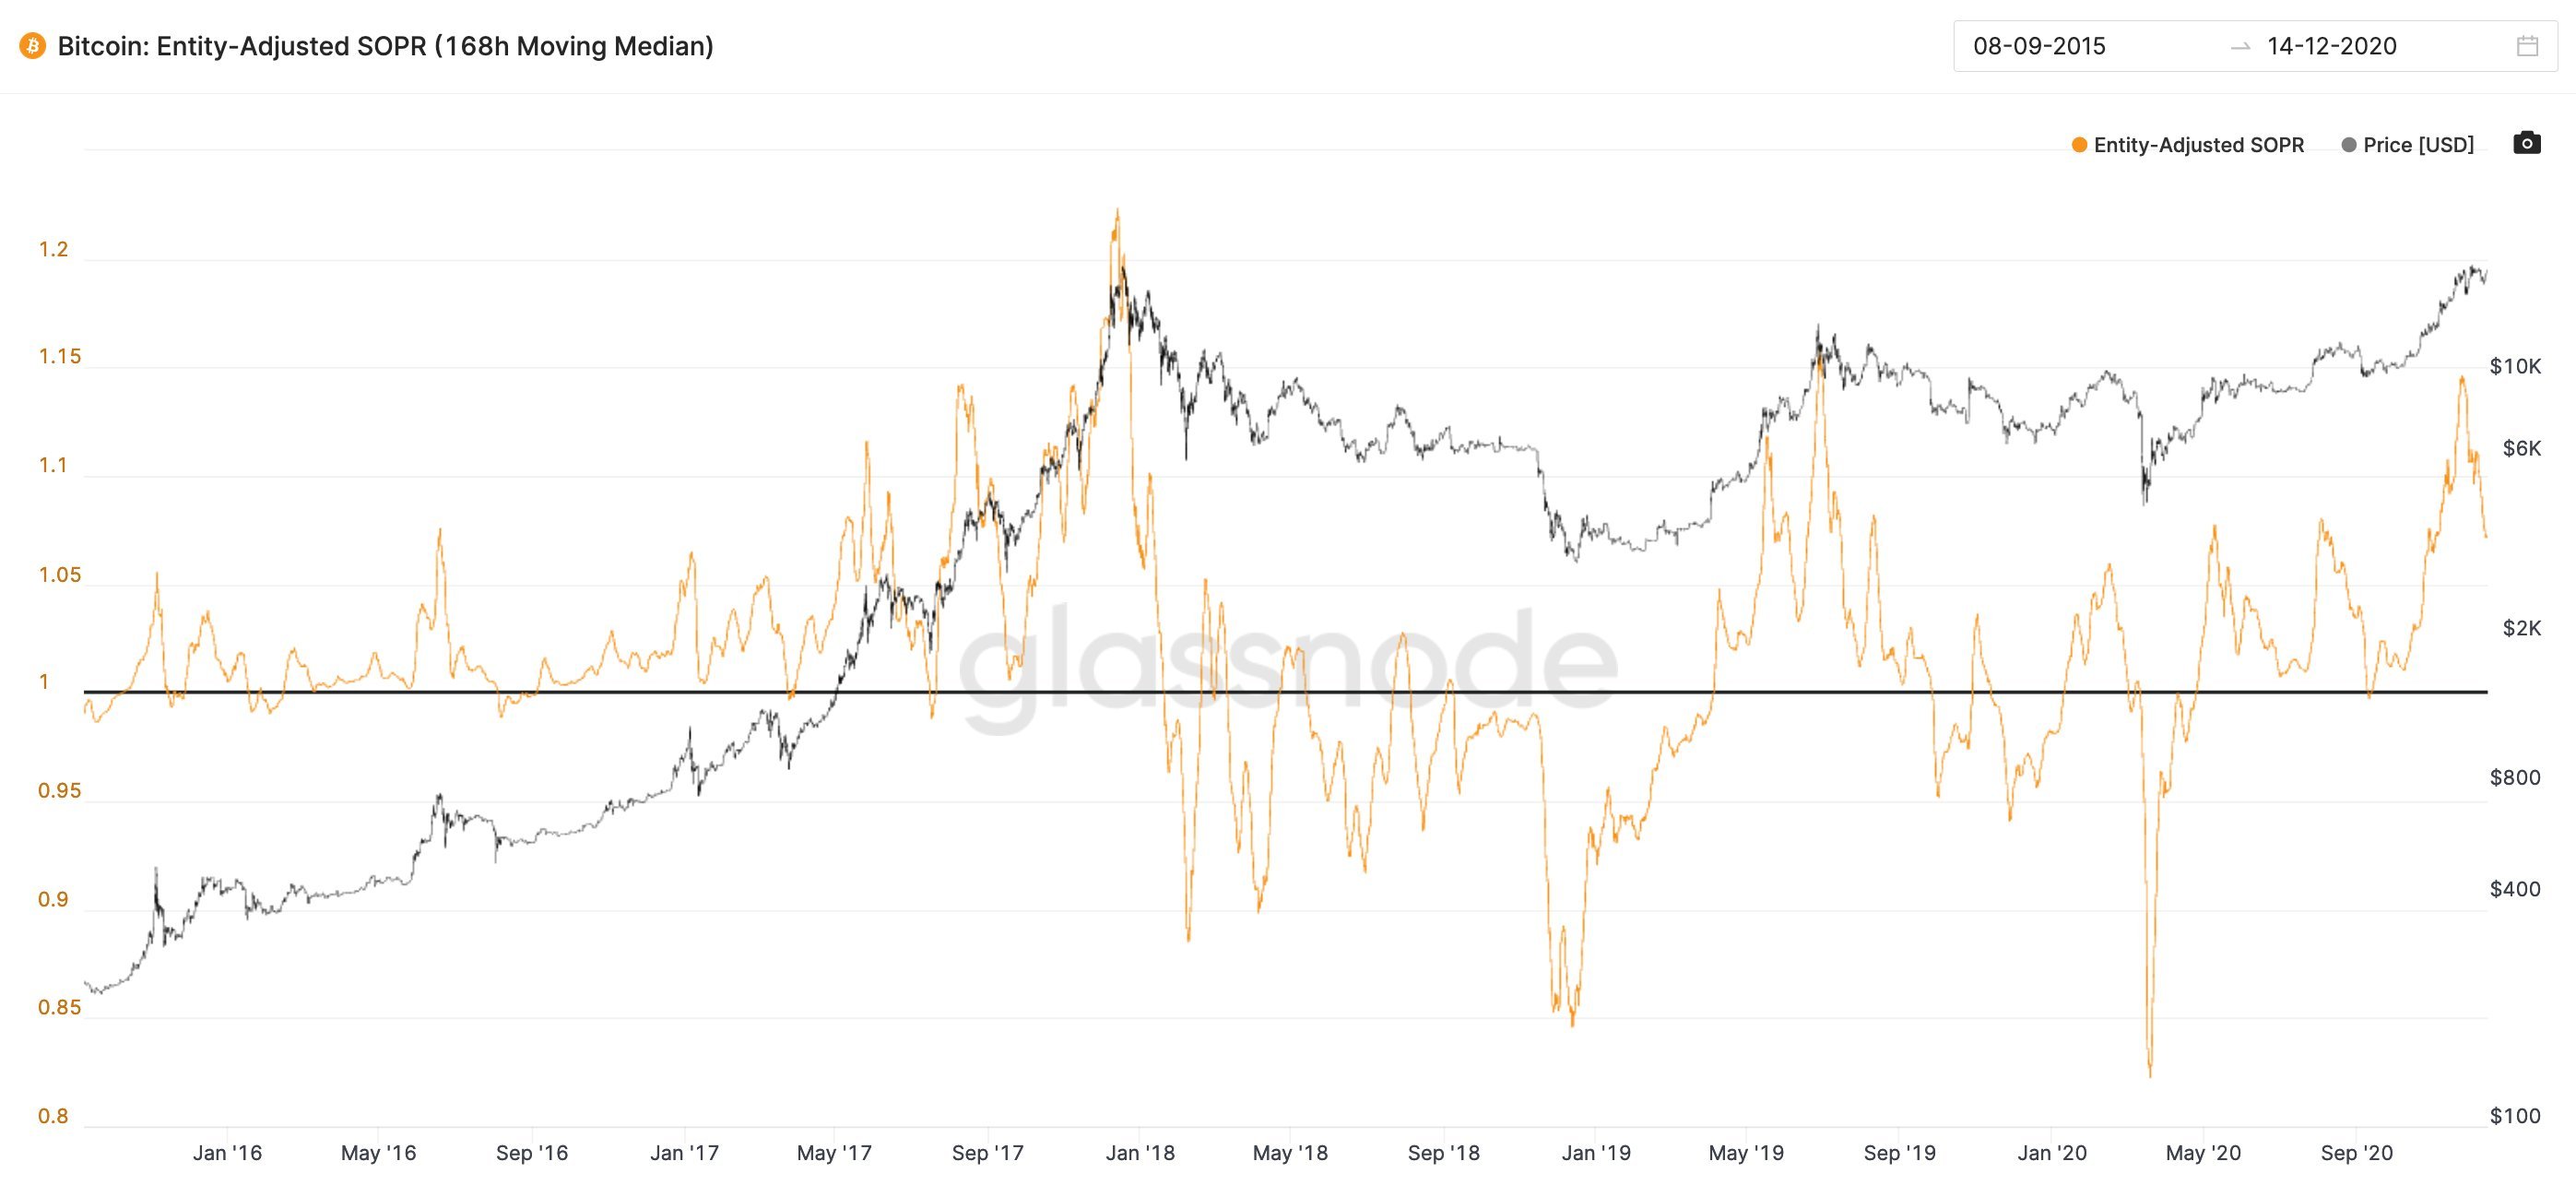
Bitcoin adjusted SOPR chart
The chart above had been adjusted only to consider coins that are moving between different investors. According to the chart, the SOPR is retreating and could stay that way until January, when a bounce is anticipated.
Bitcoin price has also retreated after hitting a double-top pattern at $19,500. If losses overshoot the support at $19,000, BTC might plummet to the 100 Simple Moving Average at $18,800. The bearish leg is likely to stretch to the critical support at the 200 SMA (marginally above $18,000).
%20(91)-637436076271906130.png)
BTC/USD 4-hour chart
Note that Bitcoin recently hit a December low at $17,600. Therefore, bears could continue exploring the rabbit hole until formidable support is established.
Author

John Isige
FXStreet
John Isige is a seasoned cryptocurrency journalist and markets analyst committed to delivering high-quality, actionable insights tailored to traders, investors, and crypto enthusiasts. He enjoys deep dives into emerging Web3 tren


