Bitcoin Price Prediction: The range is too tight, Bitcoin gets ready for a breakthrough - Bitcoin confluence
- BTC/USD paralyzed in a tight range as the market remains directionless.
- An important support is created by $9,300. the first resistance is at $9,500.

Bitcoin (BTC) has barely moved since the start of the day. Moreover, the first digital asset has been locked in a tight range since May 15 as the cryptocurrency market strugglse to find the direcion amid rising global uncertainty. The downside movements are limited by the daily SMA50 and 1-hour SMA200 located under $9,400, while the upside is capped by $9,550.
At the time of writing, BTC/USD is changing hands at $9,430, while the RSI on a daily chart implies that the range-bound trading may stay in place during the nearest seccions. The intraday charts support the consolidation with a mild bullish bias. However, the consolidation period often ends in violent market movements
BTC/USD daily chart
-637280777859462072.png)
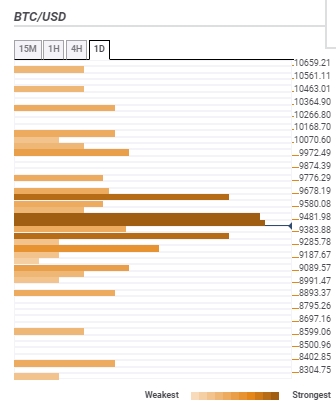
Bitcoin confluence levels
There are a lot of strong technical barriers clustered both above and below the current price, which means, Bitcoin bulls might have a hard time building a recovery momentum. Meanwhile, bears will also face several tough barriers on their way down. Let's have a closer look at the support and resistance levels.
Resistance levels
$9,500 - 4-hour SMA200 and SMA50, 1-hour SMA200, upper line of 1-hour Bollinger Band and 61.8% Fibo retracement daily
$9,600 - SMA100 (4-hour), the middle line of the daily Bollinger Band, 23.6% Fibo retracement monthly
$10,000 - the highest level of the previous week
Support levels
$9,300 - 23.6% Fibo retracement daily and weekly, 38.2% Fibo retracement monthly
$9,000 - Pivot Point 1-day Support 2, the lowest level of the previous week
$8.850 - 61.8% Fibo retracement monthly.
BTC/USD, 1-day
Author

Tanya Abrosimova
Independent Analyst


