Bitcoin Price Prediction: Downside is the path of least resistance as long as $12,000 intact— Bitcoin confluence
- BTC/USD bulls struggle to push the price through major resistance
- The first local support is created by a $11,500 handle.

Bitcoin (BTC) has been range-bound below $12,000 since the previous week. A cluster of technical barriers discourages speculative traders, many of whom are disappointed by the fake breakthrough. At the time of writing, BTC/USD is changing hands at $11,635, having recovered from the intraday low of $11,516. The coin is mostly unchanged both on a day-to-day basis and since the beginning of the day.
BTC/USD daily chart
On the intraday charts, the local resistance is created by a combination of 1-hour SMA50 and the middle line of the 1-hour Bollinger Band at $11,700. Once it is out of the way, the upside is likely to gain traction with the next focus on $11,900. This area is reinforced by 1-hour SMA200, also, it stopped the recovery on Monday, August 24; a sustainable move above this area will open up the way to the psychological $12,000. On the downside, the first support comes at the intraday low of $11,500.
-637339509107225548.png)
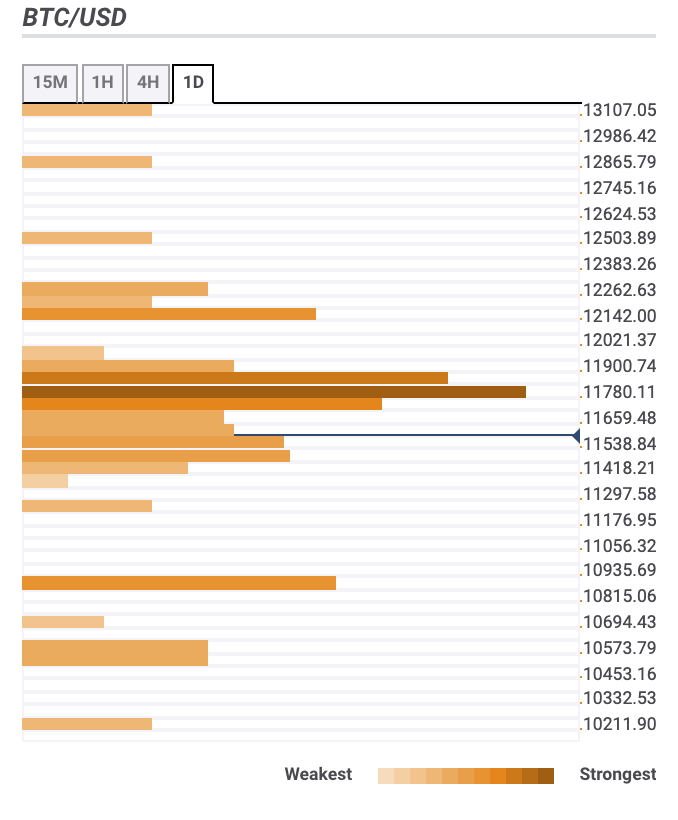
Bitcoin confluence levels
The vast majority of technical barriers are clustered above the current price, on approach to $12,000. It means that Bitcoin bulls might have a tough time moving upwards. Meanwhile, the way to the South now looks like the path of the least resistance. Let’s have a closer look at support and resistance levels for BTC/USD.
Resistance levels
$11,800 — 4-hour SMA100, the middle line of the daily Bollinger Band, 38.2% Fibo retracement daily, 23.6% Fibo retracement daily and weekly
$11,900 — 4-hour SMA200, the upper line of the 4-hour Bollinger Band and the 1-hour Bollinger Band
$12,100 — the upper line of the daily Bollinger Band, 61.8% Fibo retracement weekly
$12,500 — the highest level of the previous week
Support levels
$11,500 — 161.8% Fibo projections daily, the lower line of the 4-hour Bollinger Band, the lowest level of the previous week, the highest level of the previous month
$11,200 — Pivot Point 1-week Support 1
$10,800 — Pivot Point 1-week Support 2, 23.6% Fibo retracement monthly
BTC/USD, 1-day
Author

Tanya Abrosimova
Independent Analyst


