Bitcoin Price Forecast: BTC fails to recover as Metaplanet buys the dip
- Bitcoin price struggles around $95,000 after erasing gains from Friday’s relief rally over the weekend.
- Bitcoin’s weekly price chart posts the first major decline since President-elect Donald Trump’s win in November.
- Spot ETFs see large volume outflows while Metaplanet spends nearly $60 million to buy the Bitcoin dip.
- A Bitcoin strategic reserve could represent 35% of the US national debt by 2049 if the country acquires 1 million BTC tokens, VanEck says.

Bitcoin (BTC) hovers around $95,000 on Monday after losing the progress made during Friday’s relief rally. The largest cryptocurrency hit a new all-time high at $108,353 on Tuesday but this was followed by a steep correction after the US Federal Reserve (Fed) signaled fewer interest-rate cuts than previously anticipated for 2025.
Spot Bitcoin ETFs recorded large outflows to the tune of nearly $950 million on the last two days of the week.
Bitcoin slips to $95,000, institutions buy the dip
Bitcoin has erased nearly 12% of its value from its all-time high and hovers around the $95,000 level on Monday.
Some big players in the industry have decided to add to their holdings amid the recent price decline. Japanese investment firm Metaplanet Inc. said on Monday that it spent nearly $60 million to buy 620 BTC. The government from El Salvador also accumulated 29 BTC over the past week, pushing its Bitcoin reserve to 5,995 BTC, worth over $560 million, according to Lookonchain data.
The El Salvador government is ramping up its $BTC accumulation!
— Lookonchain (@lookonchain) December 23, 2024
Over the past week, El Salvador purchased 29 $BTC($2.84M), bringing its total holdings to 5,995 $BTC($562M).https://t.co/ViqrVRGXfi pic.twitter.com/ZXaKIVhzkm
Institutional demand saw whipsaw moves last week. Spot ETFs poured $1.4 billion in Bitcoin at the beginning of last week, but pulled nearly $950 million out in the last two days as the sharp correction unfolded.
The Bitcoin fear and greed index at Alternative.me reads “Greed” after the recent BTC pullback. This shows that the sentiment among traders remains broadly positive even as the largest cryptocurrency consolidates.
Bitcoin Technical Analysis: Momentum indicators remain bullish
BTC has suffered its largest weekly drop since President-elect Donald Trump’s election win at the beginning of November, as seen on the BTC/USDT weekly price chart.
The Relative Strength Index (RSI) reads 67, stable under the overbought mark at 70. The Moving Average Convergence Divergence (MACD), a key momentum indicator, flashes green histogram bars above the neutral line. This shows an underlying positive momentum in BTC price trend on the weekly timeframe.
If Bitcoin attempts a recovery, the $100,000 milestone acts as a first resistance. Next up, the all-time high at $108,353 emerges.
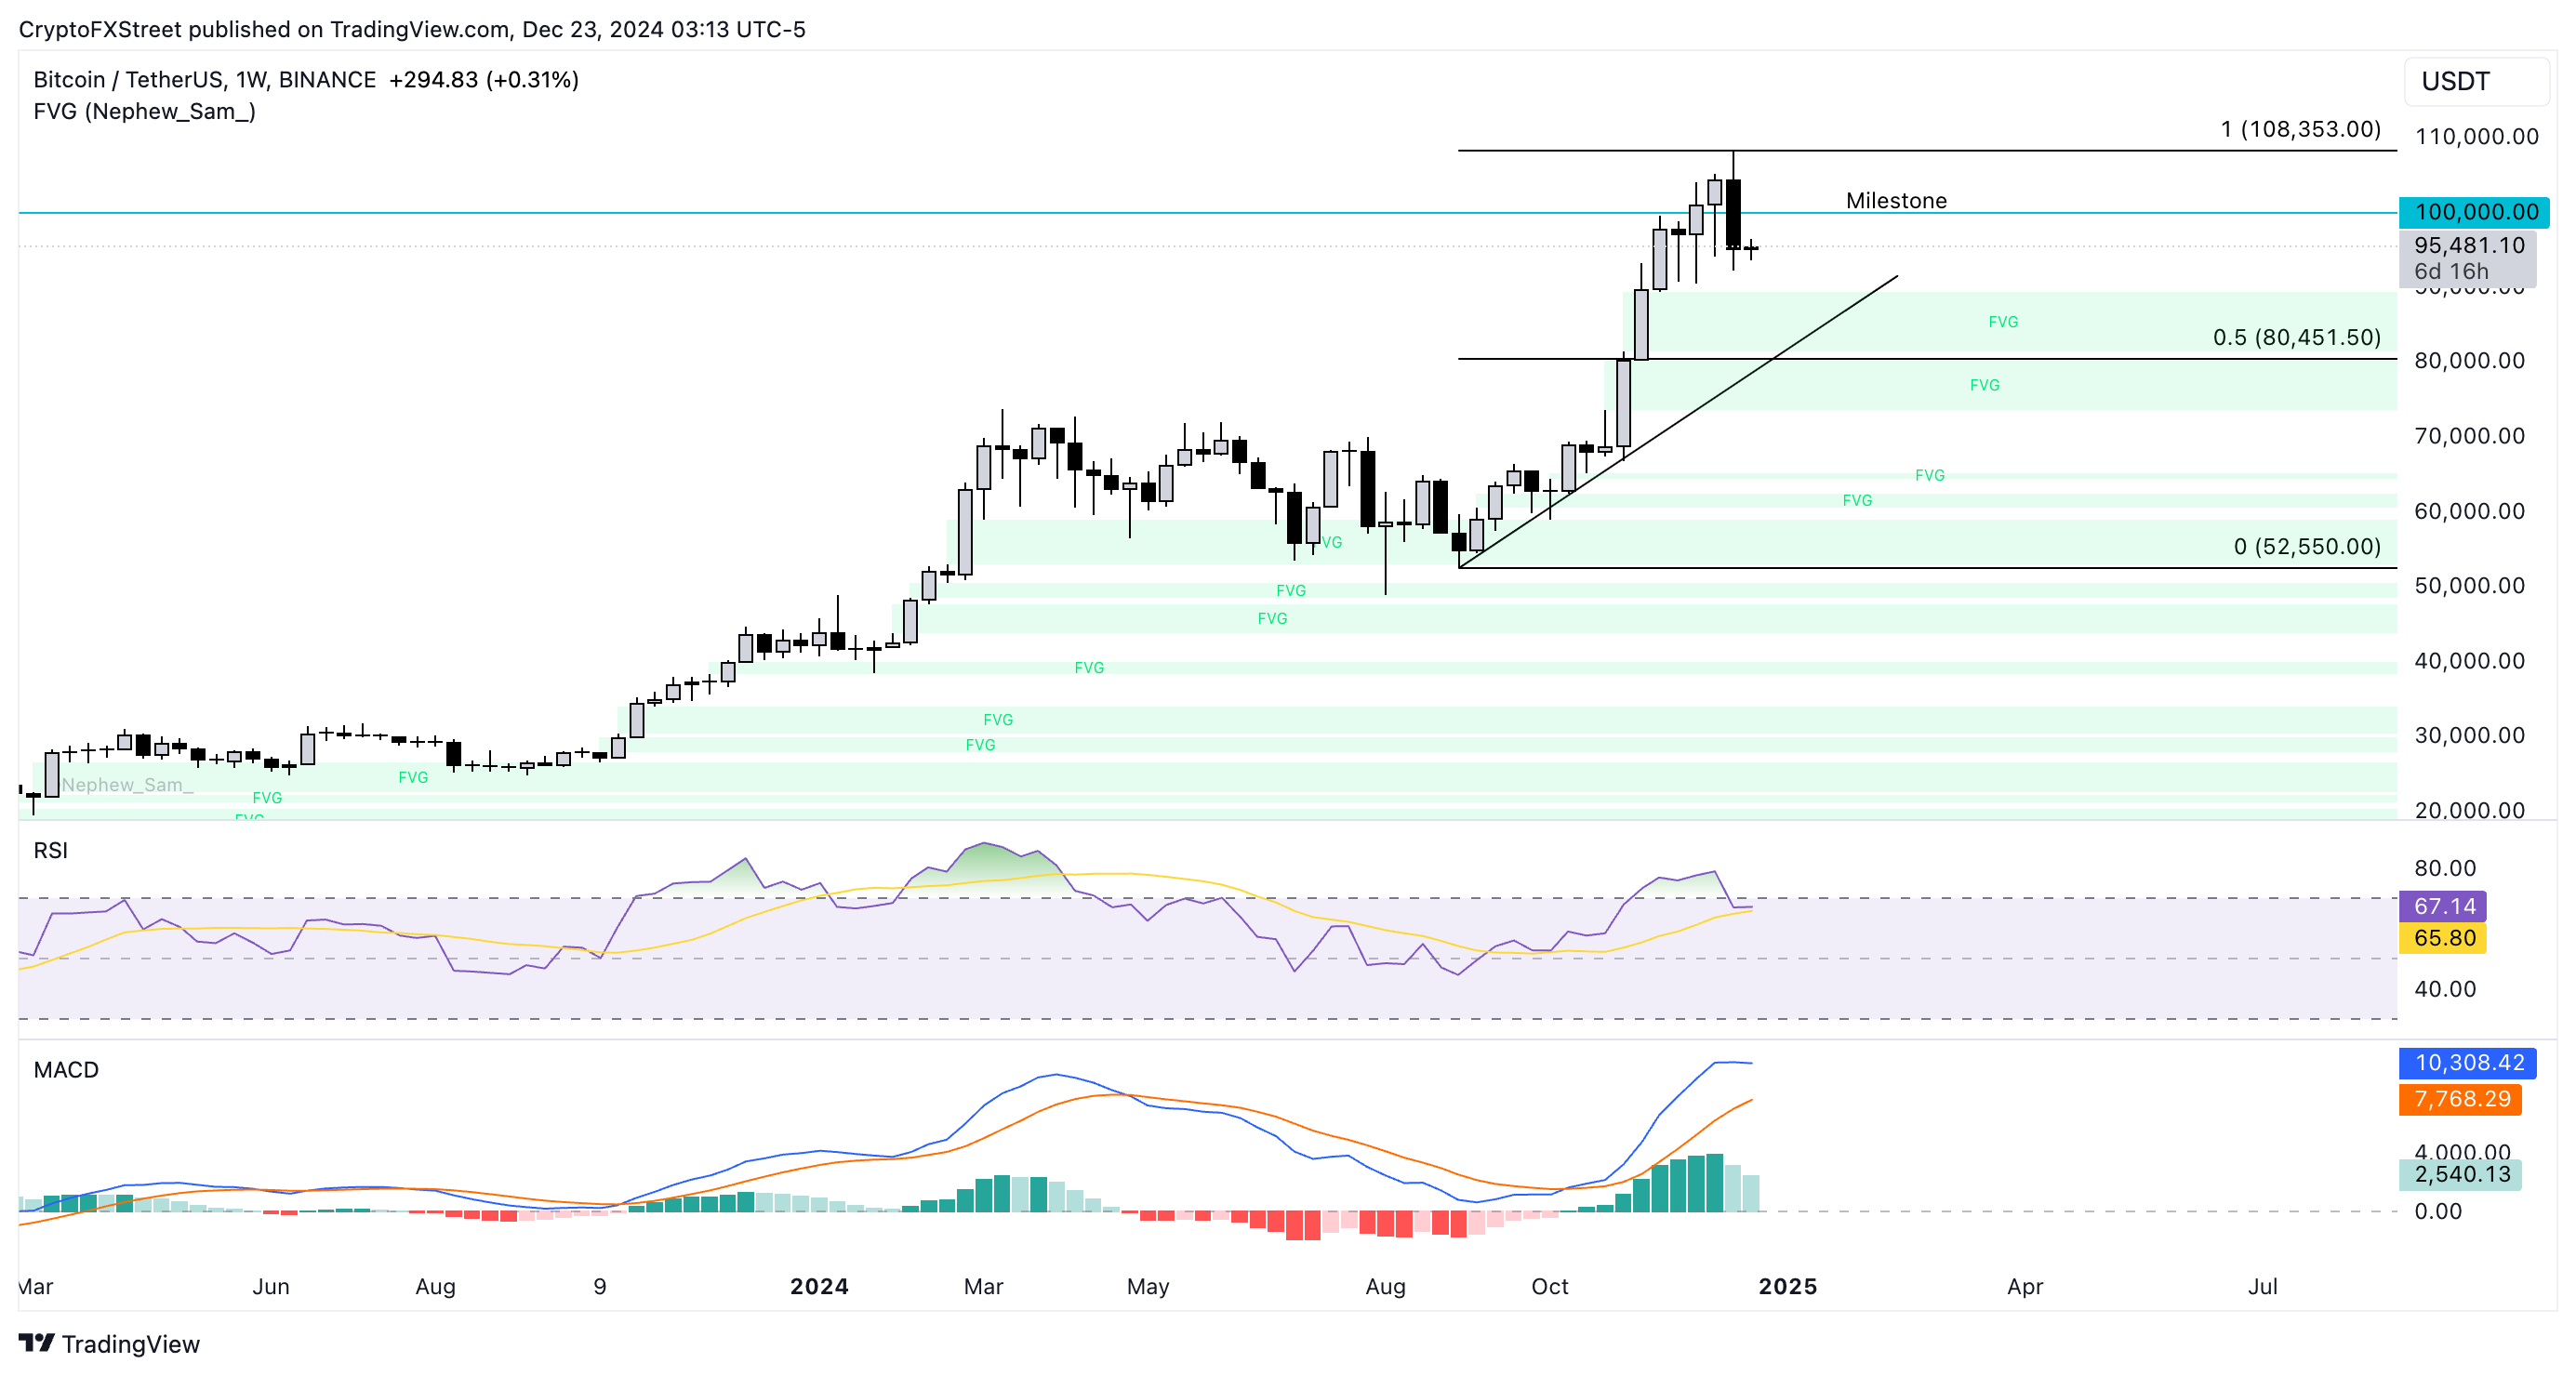
BTC/USDT weekly price chart
In case the correction resumes, Bitcoin could find first support at the upper boundary of the imbalance zone, which extends between $81,500 and $89,376.
VanEck report makes key revelations about Bitcoin strategic reserve
According to a research report published by ETF fund manager VanEck, if the US government followed the plan to acquire 1 million BTC, the reserve could represent 35% of the national debt by 2049.
According to the researchers, this would offset $42 trillion in liabilities under the assumption that US debt compounds at 5.0% from a base of $37 trillion between 2025-2049, and Bitcoin compounds at 25% annually over the same period from a starting value of $200,000.
The report outlines how the US could create a national BTC reserve even without legislation and facilitate the acquisition of Bitcoin.
“We believe the US should avoid repeating Germany’s mistake. While critics like Peter Schiff have urged President Biden to sell the US’s Bitcoin before Trump’s inauguration, a well-managed reserve could provide significant long-term value,” the analysts said.
Author

Ekta Mourya
FXStreet
Ekta Mourya has extensive experience in fundamental and on-chain analysis, particularly focused on impact of macroeconomics and central bank policies on cryptocurrencies.