Bitcoin price analysis: BTC/USD sandwiched between SMA100 and SMA200 on a daily chart
- Bitcoin has been moving sideways amid low market activity.
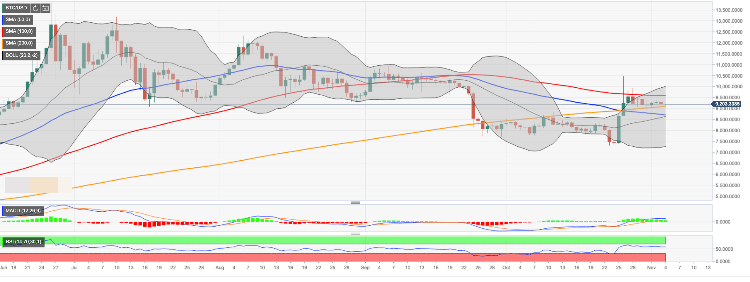
- The critical support zone is created by SMA200 daily.

Bitcoin topped at $10,484 on October 26 and has been in retreat ever since. Bulls made another attempt to launch a new rally on October 28, but stopped short of $10,000. At the time of writing, BTC/USD is changing hands at $9,200, having recovered from the intraday low of $9,127. BTC/USD has barely changed on a day-to-day basis and since the beginning of the day moving within a narrow range.
BTC/USD, the technical picture
Looking technically, BTC/USD is supported by SMA200 (Simple Moving Average) daily currently at $9,100. It is closely followed by a psychological $9,000 where fresh short-term buying interest is likely to appear. once it gives way, the sell-off may gain traction with the next bearish aim at $8,700. This support area is created by a confluence of SMA50 and the middle line of the Bollinger Band on a daily chart. Meanwhile, the ultimate support comes at $7,800. This barrier stopped the sell-off on numerous occasions in October.
On the upside, the recovery is limited by $9,500. This area is strengthened by SMA100 daily at $9,588. We will need to see a sustainable move above this handle for the upside to gain traction with the next focus on the highest level of the previous week $9,938 followed by a psychological $10,000.
BTC/USD, daily chart
Author

Tanya Abrosimova
Independent Analyst


