Bitcoin Price Analysis: BTC/USD risks a drop to $10,500 amid bearish technical set up


  • BTC bulls appear to face exhaustion after rejection at higher levels.
  • A potential rising wedge formation spotted on the hourly chart.
  • Acceptance below 10,693 could revive the bearish bias.

Bitcoin (BTC/USD) reversed Friday’s temporary reversal and resumed the previous bounce on Saturday, only to find stiff resistance once around the $10,800 region. The most favorite digital asset has erased early gains and trades neutral near 10,700, at the press time. The constant failure to sustain at higher levels suggests that the BTC bulls are facing exhaustion, having attempted recovery from Wednesday’s two-week lows of 10,137. The market capitalization of the No.1 crypto coin stands at $198.77 billion, as it is set to end the week about 2% lower.

Technical Outlook

BTC/USD: Hourly chart

fxsoriginalAs observed on the hourly chart, BTC/USD is teasing a rising wedge breakdown, with an hourly closing below the rising trendline support at $10,711 likely to validate the pattern.

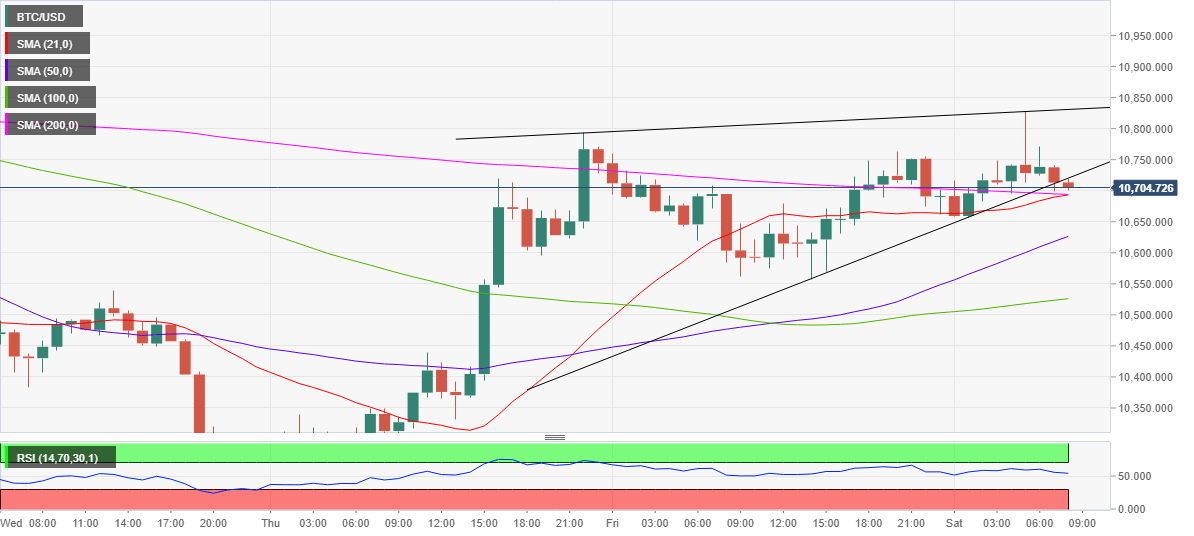
However, the BTC bulls could be offered some temporary reprieve if they manage to hold onto the critical support at 10,693, where the horizontal 200-hourly Simple Moving Average (HMA) intersects with the upward-sloping 21-HMA.

The hourly Relative Strength Index (RSI) has turned flat while trending above the midline, at 56.12, indicative of a minor bounce.

On the pattern confirmation, the sellers will aim for the 10,439 target. On its way to the said level, the bullish 50-HMA at 10,626 could cushion the downside.

Further south, the 100-HMA at 10,526 will also test the bears’ commitment.

Alternatively, if the robust support at 10,693 holds, a rebound towards the $10,800 level cannot be ruled.

The buyers will then target the next barrier at $10,830, which is the convergence of the intraday high and rising trendline resistance.

BTC/USD: Additional levels to watch

BTC/USD

Overview
Today last price 10702
Today Daily Change 25.80
Today Daily Change % 0.24
Today daily open 10691.36
 
Trends
Daily SMA20 10571.21
Daily SMA50 11156.06
Daily SMA100 10449.5
Daily SMA200 9236.51
 
Levels
Previous Daily High 10763.13
Previous Daily Low 10556.15
Previous Weekly High 11080.56
Previous Weekly Low 10137.32
Previous Monthly High 12481.06
Previous Monthly Low 10583.38
Daily Fibonacci 38.2% 10635.22
Daily Fibonacci 61.8% 10684.06
Daily Pivot Point S1 10577.3
Daily Pivot Point S2 10463.24
Daily Pivot Point S3 10370.32
Daily Pivot Point R1 10784.27
Daily Pivot Point R2 10877.19
Daily Pivot Point R3 10991.25


Information on these pages contains forward-looking statements that involve risks and uncertainties. Markets and instruments profiled on this page are for informational purposes only and should not in any way come across as a recommendation to buy or sell in these assets. You should do your own thorough research before making any investment decisions. FXStreet does not in any way guarantee that this information is free from mistakes, errors, or material misstatements. It also does not guarantee that this information is of a timely nature. Investing in Open Markets involves a great deal of risk, including the loss of all or a portion of your investment, as well as emotional distress. All risks, losses and costs associated with investing, including total loss of principal, are your responsibility. The views and opinions expressed in this article are those of the authors and do not necessarily reflect the official policy or position of FXStreet nor its advertisers. The author will not be held responsible for information that is found at the end of links posted on this page.

If not otherwise explicitly mentioned in the body of the article, at the time of writing, the author has no position in any stock mentioned in this article and no business relationship with any company mentioned. The author has not received compensation for writing this article, other than from FXStreet.

FXStreet and the author do not provide personalized recommendations. The author makes no representations as to the accuracy, completeness, or suitability of this information. FXStreet and the author will not be liable for any errors, omissions or any losses, injuries or damages arising from this information and its display or use. Errors and omissions excepted.

The author and FXStreet are not registered investment advisors and nothing in this article is intended to be investment advice.

Join Telegram

Recommended content


Recommended Content

Editors’ Picks

Ripple wipes out weekly gains, experts comment on role of Ripple stablecoin

Ripple wipes out weekly gains, experts comment on role of Ripple stablecoin

Ripple declined to $0.52 on Thursday, erasing all gains registered earlier this week. Ripple SVP Eric van Miltenburg’s comments on the firm’s stablecoin, and how it is expected to benefit the XRP Ledger and native token XRP have raised concerns among crypto experts. 

More Ripple News

Hedera HBAR slips nearly 10% after air is cleared on mistaken link with giant BlackRock

Hedera HBAR slips nearly 10% after air is cleared on mistaken link with giant BlackRock

HBAR price is down nearly 10% on Thursday, partly erasing gains inspired by the misinterpreted link with BlackRock. Despite the recent correction, Hedera’s price is up 44% in the past seven days.

More Hedera News

The reason behind Bonk’s 105% rise and if you should buy now Premium

The reason behind Bonk’s 105% rise and if you should buy now

Bonk price has shot up 105% in the past five weeks. A retracement into $0.0000216 or the $0.0000152 to $0.0000186 imbalance would be a good buying opportunity. Patient investors can expect double-digit gains from BONK that could extend up to 70%.

More Cryptocurrencies News

Injective price weakness persists despite over 5.9 million INJ tokens burned

Injective price weakness persists despite over 5.9 million INJ tokens burned

Injective price is trading with a bearish bias, stuck in the lower section of the market range. The bearish outlook abounds despite the network's deflationary efforts to pump the price. Coupled with broader market gloom, INJ token’s doomed days may not be over yet.

More Injective News

Bitcoin: BTC post-halving rally could be partially priced in Premium

Bitcoin: BTC post-halving rally could be partially priced in

Bitcoin (BTC) price briefly slipped below the $60,000 level for the last three days, attracting buyers in this area as the fourth BTC halving is due in a few hours. Is the halving priced in for Bitcoin? Or will the pioneer crypto note more gains in the coming days? 

Read full analysis

BTC

ETH

XRP