|

Bitcoin Price Analysis: BTC/USD fails to stay above the $7,500 level as market remains fearful

  • BTC/USD bulls and bears maintained a back-and-forth throughout Friday to take control of the market.
  • The fear and greed index shows that the BTC/USD market is currently experiencing "extreme fear."

BTC/USD daily chart

BTC/USD daily chart

BTC/USD dropped from $7,510.78 to $7,477.75 as the bears took control after four consecutive bullish days. The price has encountered resistance at the upper curve of the 20-day Bollinger Band. The Bollinger jaw is widening as well, which indicates increasing price volatility. The Elliott Oscillator shows three straight green sessions. The $7,373 support level needs to hold strong to prevent further downward movement.

BTC/USD 4-hour chart

BTC/USD 4-hour chart

The 4-hour chart is trending in a flag formation as bulls and bears engaged in a back and forth. The bulls failed to breach resistance at $7,586.92 and then later on at $7,534.30. The MACD line is about to cross over the signal, indicating a reversal of bullish momentum. The RSI indicator is trending along the edge of the overbought zone.

BTC/USD hourly chart

BTC/USD hourly chart

The hourly breakdown of BTC/USD is trending horizontally as well. The SMA 20 curve has held steady as the price repeatedly struggled to break past it. The 20-day Bollinger Band has narrowed considerably, which shows decreasing price volatility. The Elliott Oscillator shows increasing bearish market sentiment.

Fear and Greed Index

fxsoriginal

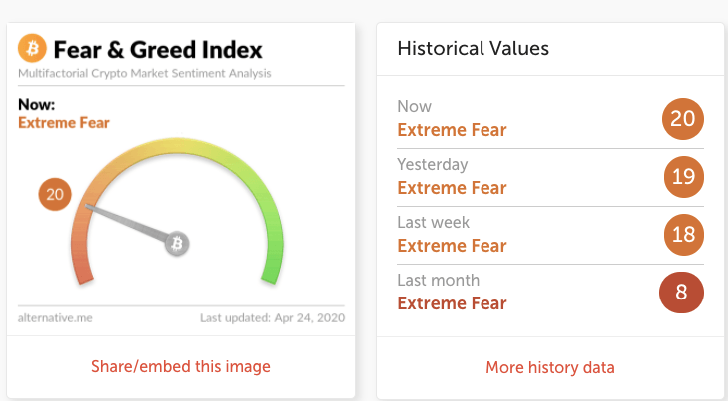
Image Credit: Alternative.me

As per the fear and greed index, the Bitcoin market is presently going through a period of extreme fear. This shows that the asset is heavily undervalued right now and may soon experience a bullish resurgence.

Key levels

BTC/USD

Overview
Today last price7478.35
Today Daily Change-32.28
Today Daily Change %-0.43
Today daily open7510.63
 
Trends
Daily SMA207069.57
Daily SMA506750.57
Daily SMA1008024.4
Daily SMA2007974.54
 
Levels
Previous Daily High7609.48
Previous Daily Low7390.54
Previous Weekly High7765.01
Previous Weekly Low6754.64
Previous Monthly High9215.51
Previous Monthly Low3886.49
Daily Fibonacci 38.2%7525.85
Daily Fibonacci 61.8%7474.17
Daily Pivot Point S17397.62
Daily Pivot Point S27284.61
Daily Pivot Point S37178.68
Daily Pivot Point R17616.56
Daily Pivot Point R27722.49
Daily Pivot Point R37835.5


Author

Rajarshi Mitra

Rajarshi Mitra

Independent Analyst

Rajarshi entered the blockchain space in 2016. He is a blockchain researcher who has worked for Blockgeeks and has done research work for several ICOs. He gets regularly invited to give talks on the blockchain technology and cryptocurrencies.

More from Rajarshi Mitra
Share:

Editor's Picks

Ripple technical weakness persists as selling intensifies toward $1.00

Ripple grinds lower, trading around $1.10 at the time of writing on Wednesday. The sticky bearish outlook mirrors the broader crypto market, with major coins such as Bitcoin and Ethereum facing weak demand as investors de-risk.

Crypto Today: Bitcoin, Ethereum, XRP face downside pressure amid investor de-risking

Major crypto assets trade under intense headwinds on Wednesday, as market participants navigate complex geopolitical and macroeconomic environments. Bitcoin has slipped toward $61,000 after its recent rebound was sold near $64,000, leaving buyers exhausted.

Bitcoin Price Forecast: Sticky inflation fears threaten deeper sell-off in BTC

Bitcoin extends its decline on Wednesday, trading below $61,500 at the time of writing as renewed US-Iran tensions keep the risk sentiment capped. In addition, persistent capital outflows from US-listed spot Exchange Traded Funds continue to fuel selling pressure on BTC.

Pi Network extends decline as CEX outflows fail to offset bearish pressure

Pi Network edges lower on Wednesday, extending its third consecutive day of losses. The technical outlook for PI is largely bearish, with a risk of a steeper correction below $0.1184.

Bitcoin: After the bloodbath, everyone looks at $60,000
Bitcoin (BTC) hovers above $62,000 at the time of writing on Friday, weighed down by growing risk-off sentiment due to persistent geopolitical tensions in the Middle East and sticky macroeconomic uncertainty. The institutional sell-off continued to wreak havoc on capital flows, with spot Bitcoin Exchange-Traded Funds (ETFs) recording billions in outflows.