|

Bitcoin price analysis: $ 7,265 to cap the bounce amid rising wedge breakdown

  • Bitcoin trades flat on Saturday, with bias leaning to the downside.
  • Rising wedge breakdown spotted on hourly sticks, with bears eyeing 7,075.
  • However, a rebound cannot be ruled out in the near-term.

Bitcoin (BTC/USD), the most favorite cryptocurrency, is trading little changed so far this Saturday, having run into stiff resistances aligned near 7,265 region on its multiple upside attempts.

The no. 1 coin saw a temporary reversal on Friday, having formed three back-to-back doji candles on the daily chart earlier this week. Despite the bounce, the sellers appear to have returned over the last hours, as the market is unwilling to buy into any short-lived optimism. At the press time, the spot hovers around 7,250, almost unchanged over the last 24 hours while down nearly 4% on a weekly basis. Its market capitalization now stands at $ 131.56 billion or 66.60% of the total crypto market value.

Technical Overview

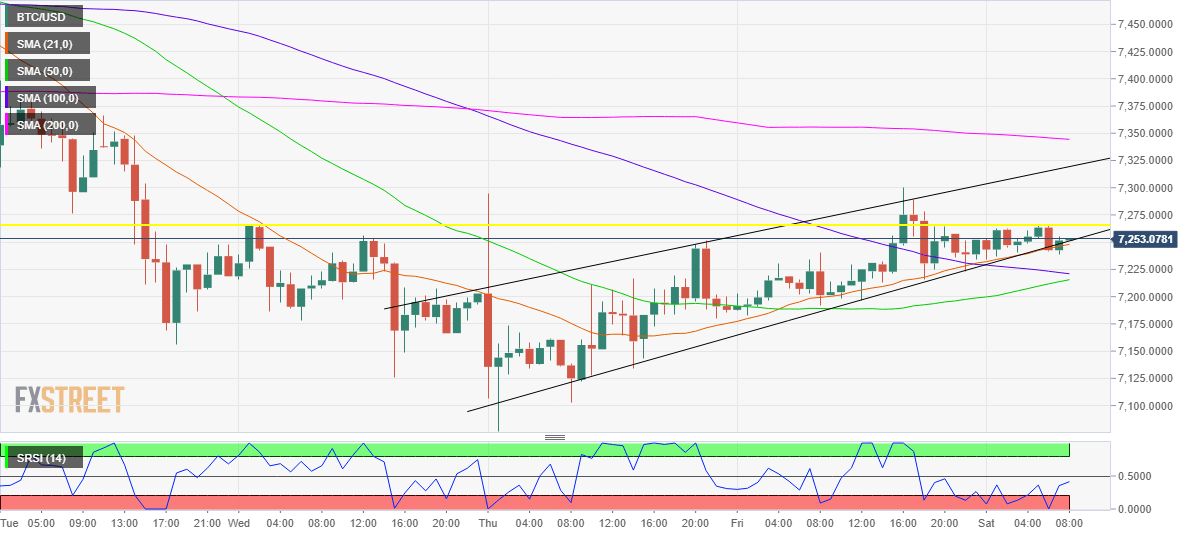
A rising wedge pattern breakdown (bearish reversal pattern) was confirmed on the hourly chart last hour after the spot breached the ascending trendline (pattern) support at 7,245. Therefore, the immediate support now awaits around 7,220 region, where the 50 and 100- hourly Simple Moving Averages (HMA) coincide. The selling pressure will intensify below the last, opening floors for a test of the pattern target aligned at 7,075, in absence of strong relevant supports.

However, an interim bounce-back towards the key supply zone near 7,265 cannot be ruled out, with the hourly Relative Strength Index (RSI) having rebounded from oversold territory towards the midline. Should the bulls manage to take out the above-mentioned hurdle, a test of the pattern upper trendline resistance at 7,317 is inevitable.

BTC/USD 1-hour chart

BTC/USD Levels to watch

BTC/USD

Overview
Today last price7251.53
Today Daily Change-0.64
Today Daily Change %-0.01
Today daily open7252.19
 
Trends
Daily SMA207341.62
Daily SMA508115.76
Daily SMA1008621.98
Daily SMA2009363.89
 
Levels
Previous Daily High7299.91
Previous Daily Low7182.44
Previous Weekly High7654.18
Previous Weekly Low7076.68
Previous Monthly High9580.19
Previous Monthly Low6526.82
Daily Fibonacci 38.2%7255.04
Daily Fibonacci 61.8%7227.32
Daily Pivot Point S17189.78
Daily Pivot Point S27127.38
Daily Pivot Point S37072.31
Daily Pivot Point R17307.25
Daily Pivot Point R27362.32
Daily Pivot Point R37424.72

Author

Dhwani Mehta

Dhwani Mehta

FXStreet

Residing in Mumbai (India), Dhwani is a Senior Analyst and Manager of the Asian session at FXStreet. She has over 10 years of experience in analyzing and covering the global financial markets, with specialization in Forex and commodities markets.

More from Dhwani Mehta
Share:

Editor's Picks

Crypto Today: Bitcoin, Ethereum, XRP recovery slows amid incessant capital outflows

The cryptocurrency remains in a broader corrective bias on Friday, despite majors such as Bitcoin (BTC), Ethereum (ETH), and Ripple (XRP) holding slightly higher than early-week support levels.

Cardano: Whale selling, cautious derivatives limit ADA rebound

Cardano is trading near $0.170 at the time of writing on Friday after staging a modest rebound from last week's sharp correction. However, the recovery remains fragile as large holders have resumed reducing their positions, adding fresh selling pressure to ADA.

Experts agree: Bitcoin nears bottom, but weak demand raises doubts

Bitcoin (BTC) is trading above $63,000 at the time of writing on Friday after rebounding from the key 200-week Simple Moving Average (SMA) near $62,000, a level widely viewed as key long-term support.

Pi Network Price Forecast: Bulls attempt comeback as bearish strength fades

Pi Network is trading at around $0.120 on Friday after a modest recovery the previous day. Despite this recent rebound, traders should be cautious as a scheduled unlock of 14.8 million PI tokens on Friday could limit the token's recovery potential by increasing market supply.

Experts agree: Bitcoin nears bottom, but weak demand raises doubts
Bitcoin (BTC) is trading above $63,000 at the time of writing on Friday after rebounding from the key 200-week Simple Moving Average (SMA) near $62,000, a level widely viewed as key long-term support. The recovery may suggest that Bitcoin has found a floor after a sharp correction that spanned more than a month, but some warning signs persist.