Bitcoin may be ready for recovery as the Chinese New Year is behind us
- Bitcoin's sell-off is typical for the Chinese New Year celebrations period.
- BTC/USD needs to regain $8,450 to mitigate immediate bearish pressure.

Bitcoin (BTC) has lost nearly 6% of its value during recent seven days and hit the low of $8,217 on Friday. At the time of writing, BTC/USD is changing hands at $8,330 with the short-term recovery capped by SMA50 1-hour at $8,370. Bitcoin's market share has settled at 66.2% after a short-loved dip below 66.00%.
Bitcoin's network statistics
The share of Bitcoin addresses "in the money" recovered from 63% registered on Thursday to 70% at the time of writing, according to the statistics provided by Intotheblock. Notably, the volatility has been moving down together with the price with some lag. Thus, the 30-day volatility topped at 39.2% on January 20 and slipped to 38.79 by press time.
Chinese New Year effect
Several cryptocurrency analysts believe that the recent Bitcoin's sell-off is related to the Chinese New Year. Thus, Alex Kruger published statistical data of Bitcoin's price movements during this period, which confirms that the first digital coin tends to slide down ahead of celebrations.
Some think the Chinese New Year may impact $BTC negatively, as people sell bitcoin to purchase presents. Chinese New Year starts with the 2nd new moon after the winter solstice. This year it falls on Jan/25.
The expert concluded that the sell-off was not unusual and the recovery wouldn't be long in coming.
BT/USD: technical picture
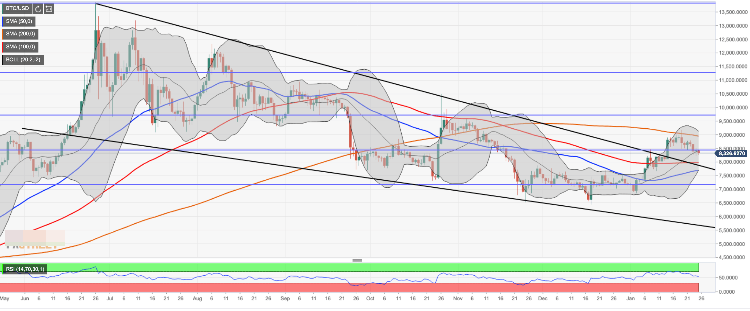
From the long-term point of view, We will need to see a sustainable move above $8,450 for the upside to gain traction. This pivotal resistance is created by 50% Fibo retracement for the upside move from December 2018 low to July 2019 high. Once it is out of the way, the recovery may be extended to the next important barrier $8,650 followed by SMA100 daily on approach to $9,000.
On the downside, strong support is created by $8,000. This zone is reinforced by SMA100 daily, and it has the potential to slow down the bears. The next important barrier is created by the broken downside trend line at $7,800.
BTC/USD daily chart
Author

Tanya Abrosimova
Independent Analyst




