Bitcoin shows strength as on-chain data hints positive bias
- Bitcoin price approaches the $56,022 support level; if it holds, recovery could continue.
- US Bitcoin Spot ETF data recorded a second consecutive day of inflows, of $117 million on Tuesday.
- On-chain data paints a bullish picture with miners reducing selling pressure, negative Exchange flow balance, and decreasing supply on exchanges.

Bitcoin (BTC) retraces slightly on Wednesday and approaches the critical support level of $56,000; if it holds, it might pave the way for further recovery. However, Wednesday’s upcoming US Consumer Price Index (CPI) report could trigger volatility in the largest cryptocurrency by market capitalization. Moreover, on-chain data hints at a rally, as shown by miners’ reduced selling pressure, negative exchange flow balance, and decreasing supply on exchanges.
Daily digest market movers: BTC set for a volatility
- Bitcoin price could experience volatility in the upcoming August US CPI report on Wednesday.
“The market participants are expected to closely watch the release of US inflation figures gauged by the CPI on Wednesday, as it could give extra signals about the extent of the Fed’s expected rate cut this month, especially after Fed Chair Jerome Powell suggested at the Jackson Hole Symposium that it may be time to adjust monetary policy,” said Pablo Piovano, analyst at FXStreet.
In this context, the upcoming US Consumer Price Index (CPI) report is a key factor, especially given the market’s doubts about a 25- or 50-basis point interest rate cut by the Fed in September after the job market has worsened in recent months. The largest cryptocurrency by market capitalization has historically reacted to the data release.
- US Bitcoin Spot Exchange Traded Funds (ETF) data recorded a second consecutive day of inflows, of $117 million on Tuesday. This three-digit million in inflows was recorded after a long time, since August 26. This infows shows a sign of slight improvement in market sentiment. The total Bitcoin reserves held by the 11 US spot Bitcoin ETFs are improving during this week and currently hold $49.39 billion in Assets Under Management (AUM).
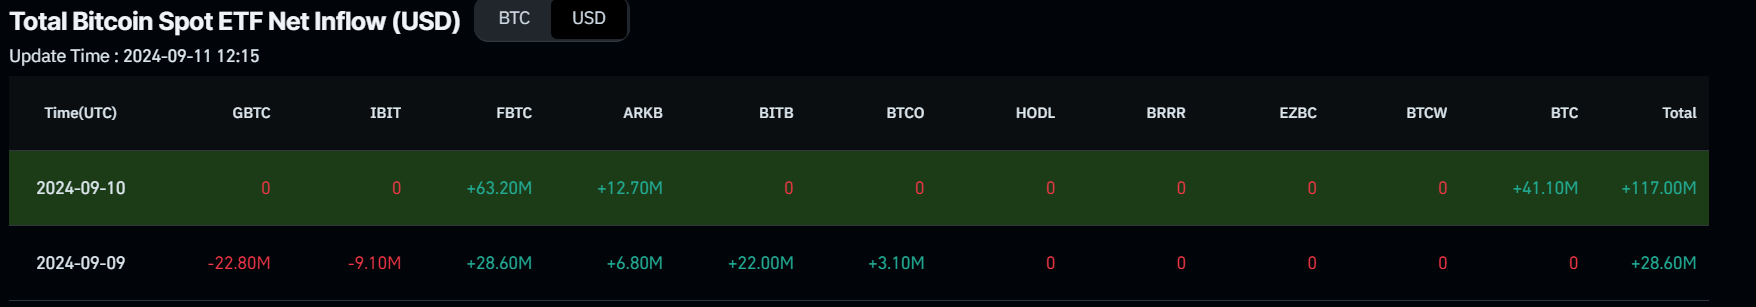
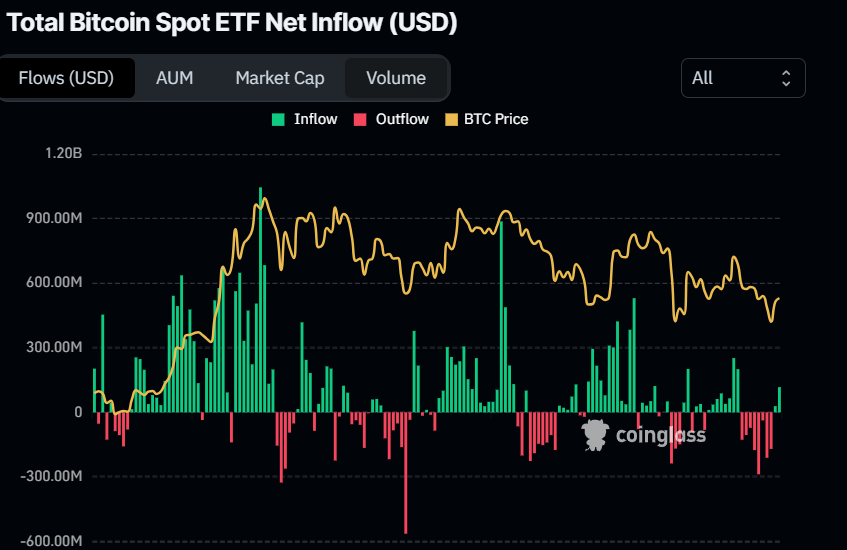
Bitcoin Spot ETF Net inflow chart
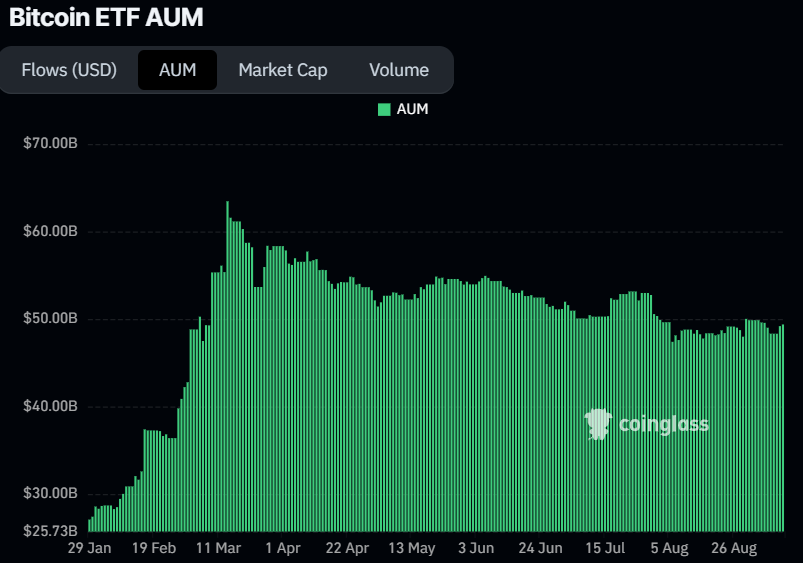
Bitcoin ETF AUM chart
- Coinglass’s Binance BTC’s long-to-short ratio is 1.93, and it has been trading above one since August 24, meaning more traders are betting on the asset’s price to rise.
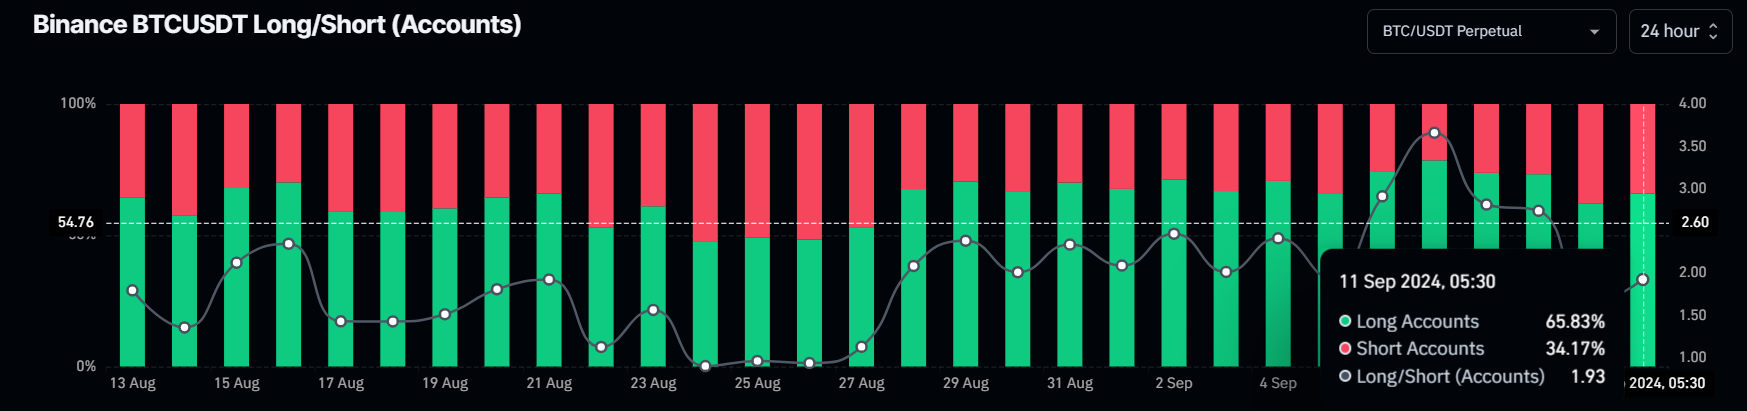
Binance BTC’s long-to-short ratio chart
- Santiment’s Exchange Flow Balance shows the net movement of tokens into and out of exchange wallets. A positive spike indicates more tokens have entered than exited, suggesting selling pressure from investors. Conversely, a negative value indicates more tokens left the exchange than entered, indicating less selling pressure from investors and holders accumulating the asset.
In the case of BTC, this metric slumped from -1,435 to -25,751 from Sunday to Tuesday, coinciding with a 6.4% price rise. This negative uptick indicates increased buying activity among investors.
During this event, the Bitcoin Supply on Exchanges declined by 2%. This is a bullish development, as holders remove BTC from exchanges and hold it in cold wallets, further denoting investor confidence in Bitcoin.
%20[14.35.21,%2011%20Sep,%202024]-638616515555366339.png)
Bitcoin Exchange Flow Balance and Supply on Exchanges chart
- CryptoQuant’s Miners’ Position Index (MPI), calculated as the ratio of the number of all miners’ outflows in USD divided by the 365-day moving average, supports Bitcoin’s positive outlook. An increase in the index paints a bearish picture as miners become more involved in selling and raising selling pressure. Conversely, a decrease in the metric suggests that miners become less involved in selling and decreases selling pressure.
Bitcoin’s MPI index currently stands at -0.82, below its 7-day Simple Moving Average (SMA), and has decreased since August 5. This indicates reduced selling pressure and miners’ confidence in the market.
%20(1)-638616515875985210.png)
Bitcoin Miners’ Position Index chart
Technical analysis: BTC approaches key support level at $56,000
Bitcoin price retested and found support around the $54,000 level on Saturday, bouncing 6% over the next three days. It broke and closed above the $56,022 daily resistance level on Monday. On Wednesday, it trades down by 2% at $56,399, approaching the daily support at $56,022 again.
If the $56,022 continues to hold as support, BTC could rise 6% to retest its 50% price retracement level at $59,529 (drawn from a high in late July to a low in early August).
The Relative Strength Index (RSI) on the daily chart is hovering around its neutral level of 50, indicating indecisiveness among investors. The Awesome Oscillator (AO) still trades well below its neutral level of zero. Both indicators should trade above their respective neutral levels for any upcoming recovery rally to be sustained.
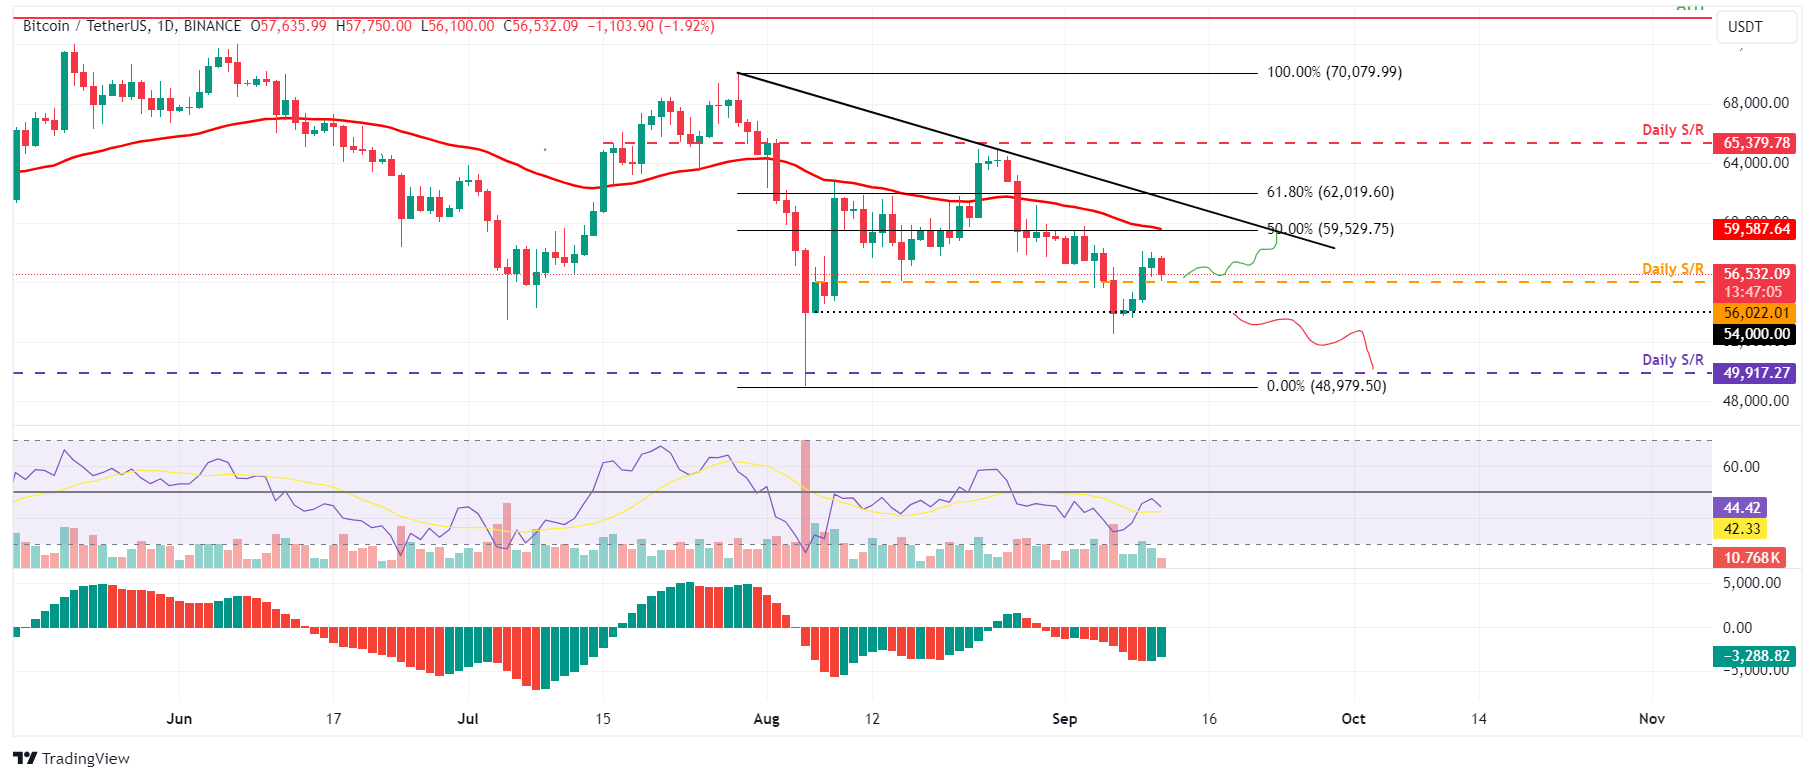
BTC/USDT daily chart
This bullish thesis will be invalidated if Bitcoin price closes below the $54,000 support level. In this scenario, BTC could decline by an additional 7% and retest the next daily support at $49,917.
Bitcoin, altcoins, stablecoins FAQs
Bitcoin is the largest cryptocurrency by market capitalization, a virtual currency designed to serve as money. This form of payment cannot be controlled by any one person, group, or entity, which eliminates the need for third-party participation during financial transactions.
Altcoins are any cryptocurrency apart from Bitcoin, but some also regard Ethereum as a non-altcoin because it is from these two cryptocurrencies that forking happens. If this is true, then Litecoin is the first altcoin, forked from the Bitcoin protocol and, therefore, an “improved” version of it.
Stablecoins are cryptocurrencies designed to have a stable price, with their value backed by a reserve of the asset it represents. To achieve this, the value of any one stablecoin is pegged to a commodity or financial instrument, such as the US Dollar (USD), with its supply regulated by an algorithm or demand. The main goal of stablecoins is to provide an on/off-ramp for investors willing to trade and invest in cryptocurrencies. Stablecoins also allow investors to store value since cryptocurrencies, in general, are subject to volatility.
Bitcoin dominance is the ratio of Bitcoin's market capitalization to the total market capitalization of all cryptocurrencies combined. It provides a clear picture of Bitcoin’s interest among investors. A high BTC dominance typically happens before and during a bull run, in which investors resort to investing in relatively stable and high market capitalization cryptocurrency like Bitcoin. A drop in BTC dominance usually means that investors are moving their capital and/or profits to altcoins in a quest for higher returns, which usually triggers an explosion of altcoin rallies.
Author

Manish Chhetri
FXStreet
Manish Chhetri is a crypto specialist with over four years of experience in the cryptocurrency industry.


