Bitcoin extends sideways grind near $7,500
- Bitcoin struggles to find direction after encountering support near $6,500.
- Technical indicators for BTC confirm netural outlook in near-term.

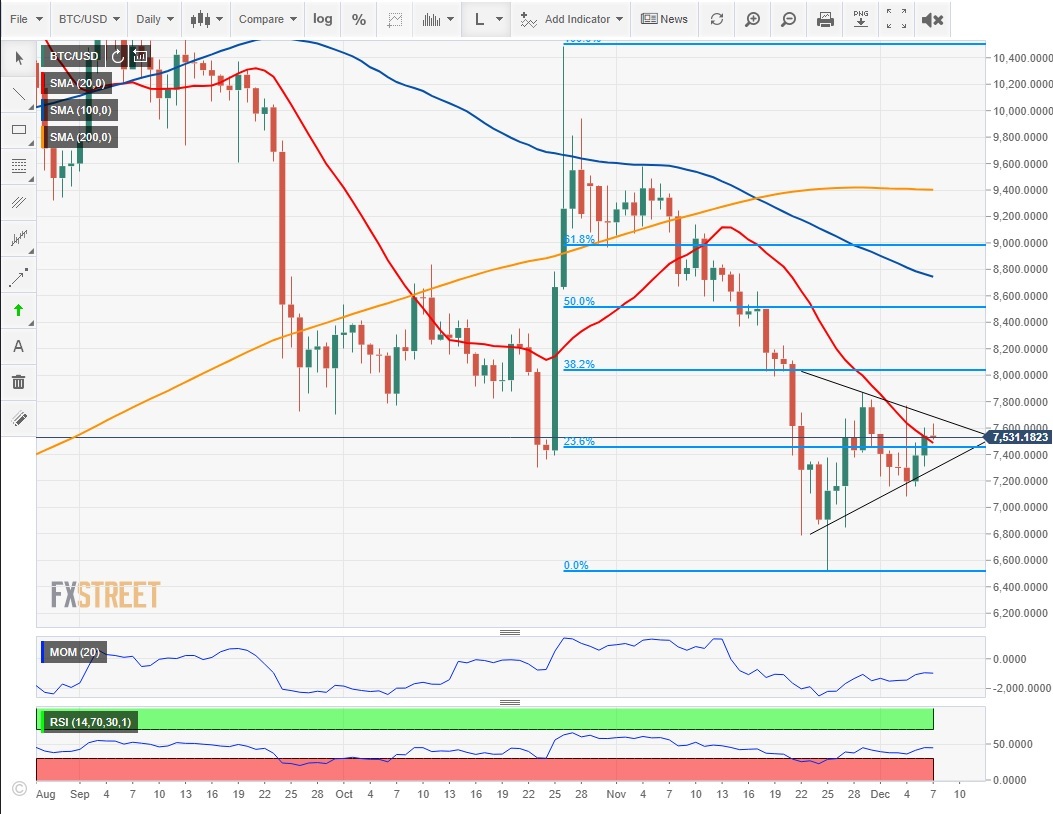
Bitcoin's (BTC) sharp drop at the end of November met strong support near $6,500 handle and allowed it to stage a modest recovery. However, BTC lost its recovery momentum before reaching the critical $8,000 handle and has been struggling to set its next short-term direction since then. As of writing, BTC was virtually unchanged on a daily basis at $7,500.
Technical outlook
Technical indicators for BTC confirm the biggest cryptocurrency's near-term neutral outlook. The Relative Strength Index (RSI) on the daily chart is moving sideways a little below the mid-point of 50 and a symmetrical triangle, which shows the market's indecisiveness, seems to be forming on the same chart. The only slightly-bullish sign is the fact that BTC closed the day above the 20-day moving average (MA) for the first time since in nearly a month on Friday. Nevertheless, it doesn't look like the pair is building up momentum for a new recovery rally.
On the downside, $7,450 (20-day MA) aligns as the initial support for the pair ahead of $7,080 (December low) and $6,500 (Nov. 25 low). Resistances, on the other hand, could be sen at $8,000 (Fibonacci 38.2% retracement of October 25- November 25 drop) ahead of $8,500 (Fibonacci 50% retracement of October 25- November 25 drop) and $8,750 (100-day MA).
Author

Eren Sengezer
FXStreet
As an economist at heart, Eren Sengezer specializes in the assessment of the short-term and long-term impacts of macroeconomic data, central bank policies and political developments on financial assets.


