Bitcoin dives 3% from its recent all-time high, is this the cycle top?
- Bitcoin investors panicked after the Fed's hawkish rate cut decision, hitting the market with high selling pressure.
- Bitcoin's four-year market cycle pattern indicates that the recent correction could be temporary.
- Bitcoin ETFs may have altered the historical crypto market cycle pattern.

Bitcoin (BTC) traded near $97,000 on Friday after its recent correction saw cryptocurrencies shedding over 5% of their total market capitalization. Despite the bearish sentiment currently dominating the market, several key factors suggest that BTC may not have topped in the current market cycle.
Bitcoin's retracement below $100K leaves investors wondering if the bull cycle is over
After reaching a high of $108,300 earlier in the week, Bitcoin experienced a decline on Wednesday following the FOMC's hawkish rate cut outlook for 2025. The Fed's decision to have only two rate cuts next year marred expectations of four rate cuts by market participants, leading to heavy selling pressure across the crypto market.
Particularly, US investors were among the top sellers, as revealed in the Bitcoin Coinbase premium plunging negative. This metric measures the difference between Coinbase's BTC/USD pair and Binance's. A decline shows higher selling pressure in the US than in the general market.
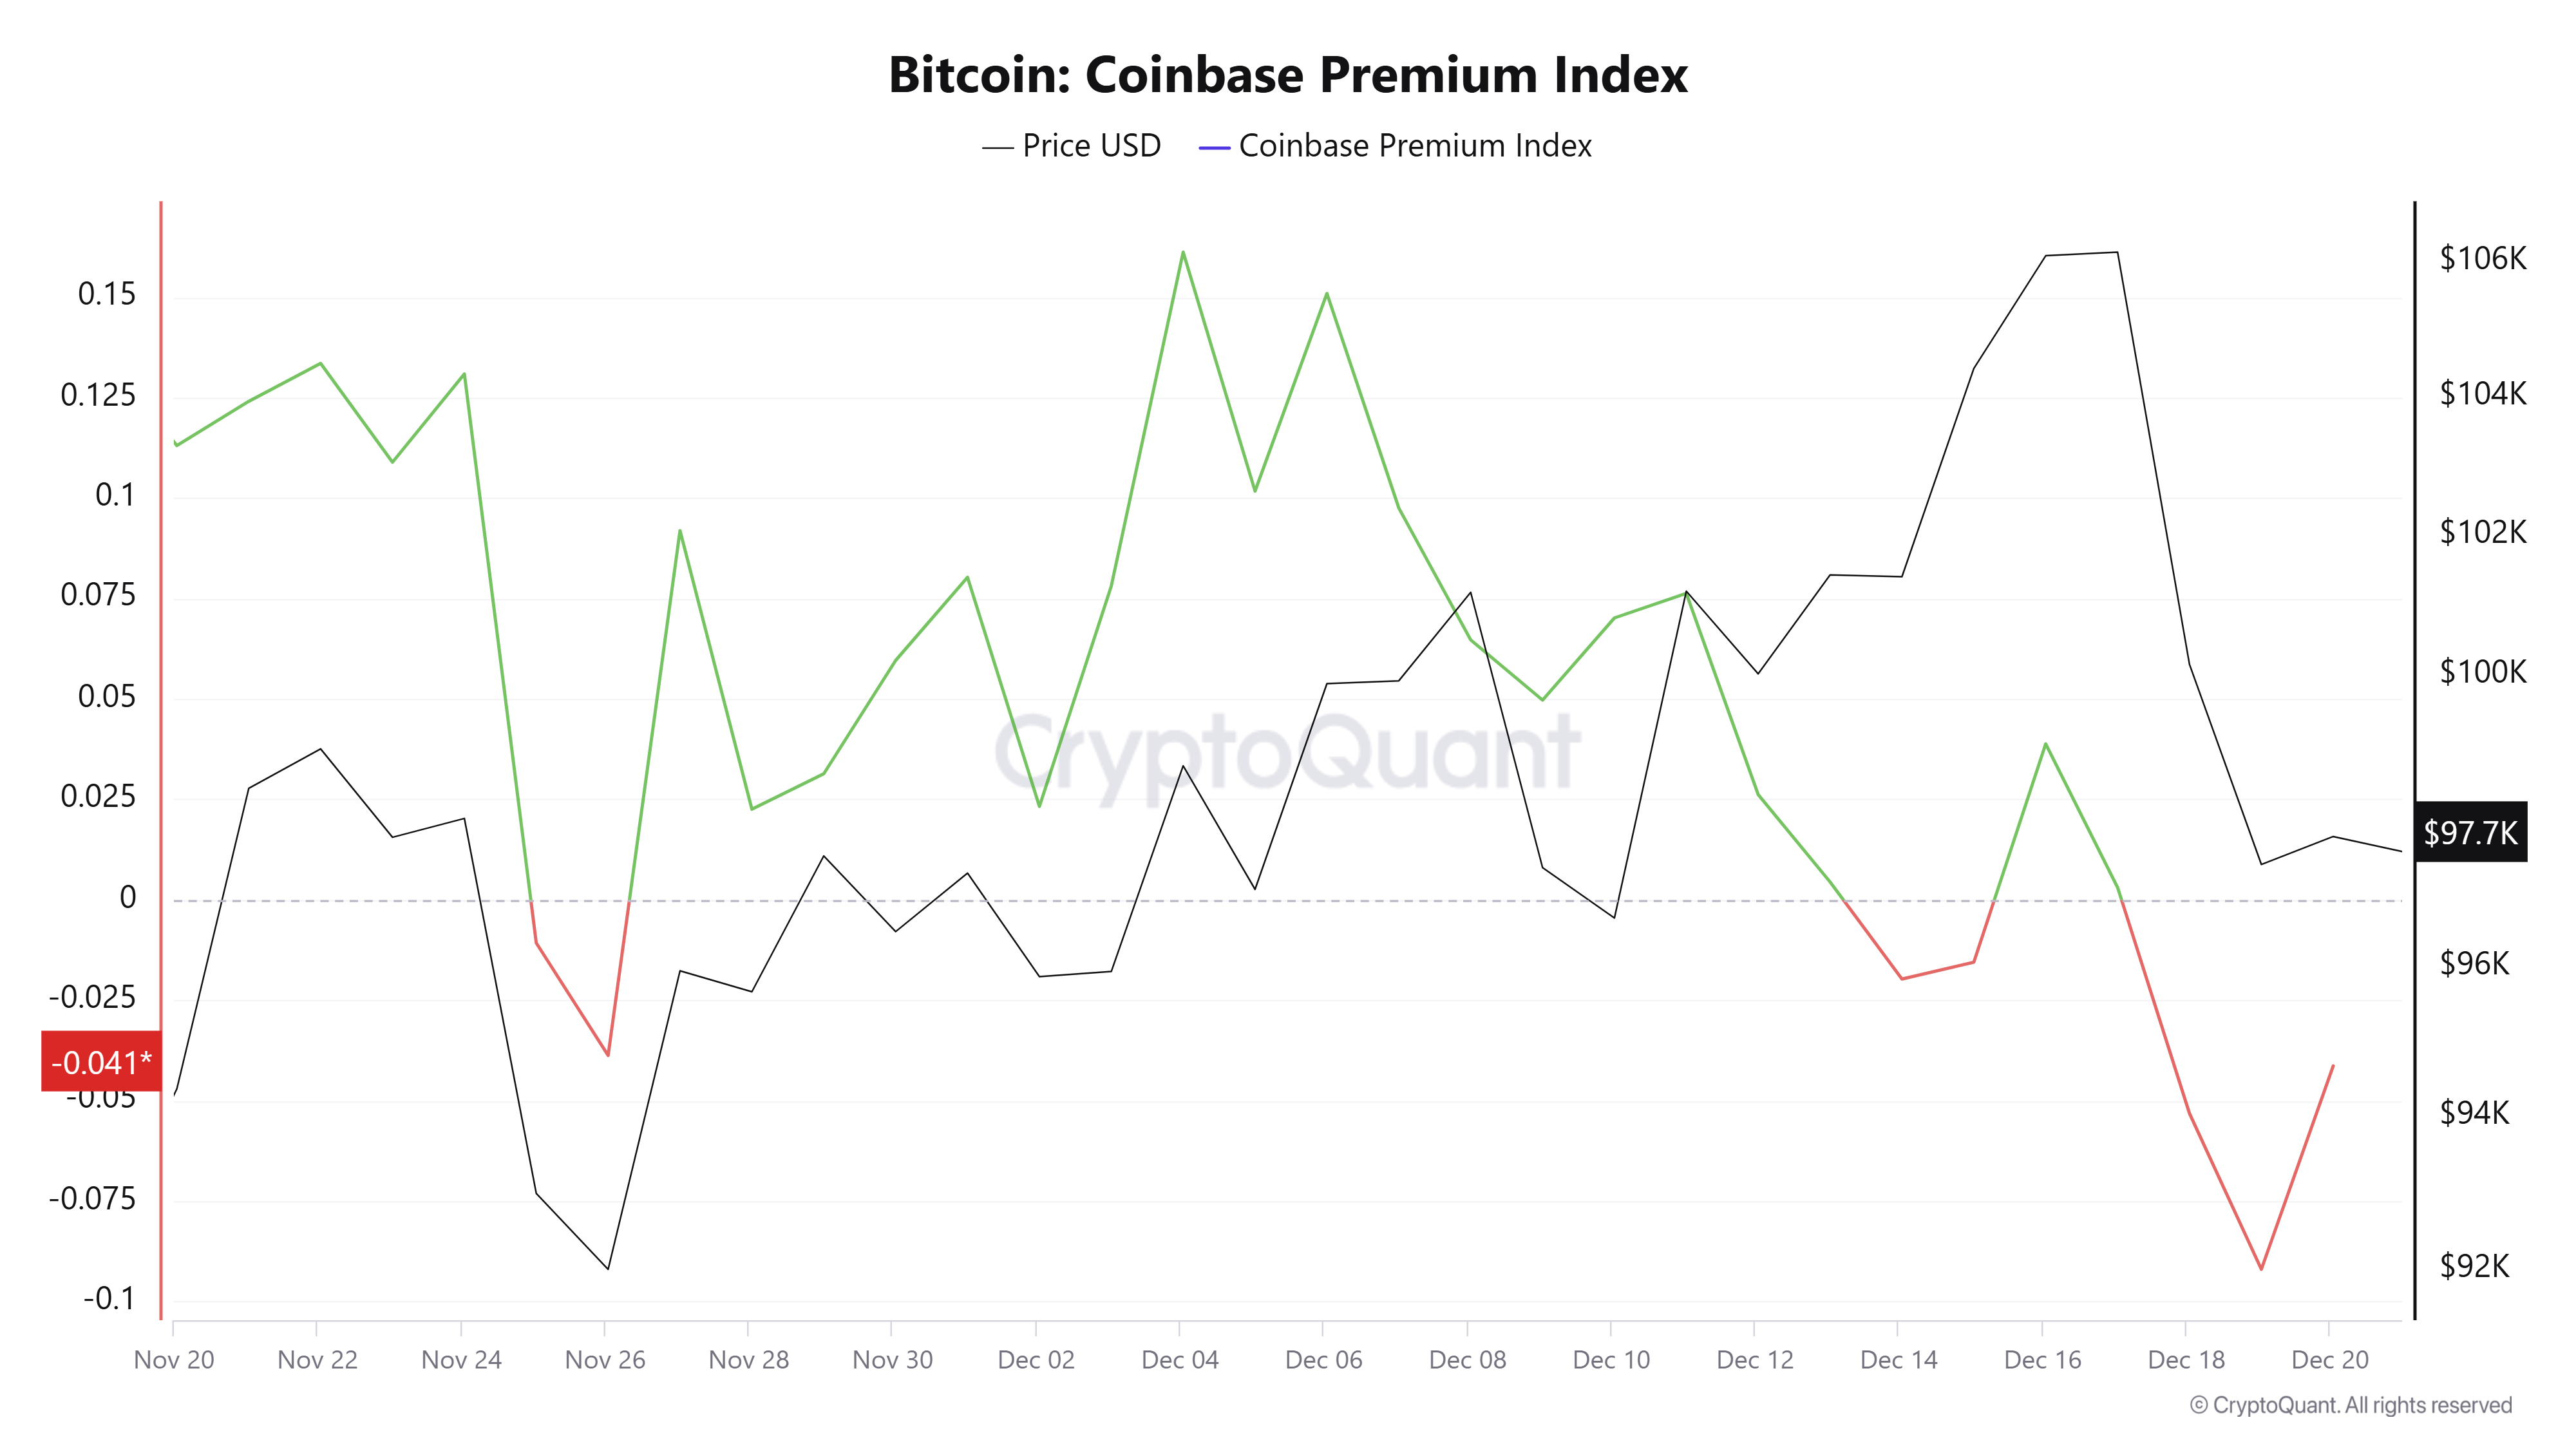
Bitcoin Coinbase Premium Index. Source: CryptoQuant
With the recent drawdown from its all-time high, most investors are contemplating if Bitcoin's bull season has run its course. The following factors reveal mixed signals:
Bitcoin Market Cycle Pattern
Historically, Bitcoin operates on a four-year market cycle pattern that begins with accumulation, bull market, distribution and bear market. Bitcoin could extend its rally into 2025 before establishing a price ceiling if the current market cycle follows this pattern. Additionally, market participants' expectation of the cycle repeating this trend could lead to a self-fulfilling prophecy.
Changing Dynamics in Historic Cycles
Conversely, while Bitcoin has shown some synergy with previous cycles, there are certain traits of changing dynamics in the current cycle. Bitcoin has historically reached new highs, on average, one year after its halving event.
This pattern was repeated in the 2015-2018 cycle, when Bitcoin's price spiked to a new peak in August 2017 after its halving in 2016.
Similarly, in the 2019-2022 cycle, its price surged to new highs in November 2021, one year after its halving event in 2020. However, this trend has been altered in the current cycle after BTC hit a new ATH in March before its halving in April.
This places two options before investors: Either the halving event is no longer a yardstick for Bitcoin's price trajectory, or BTC has yet to experience the post-halving growth from previous cycles.
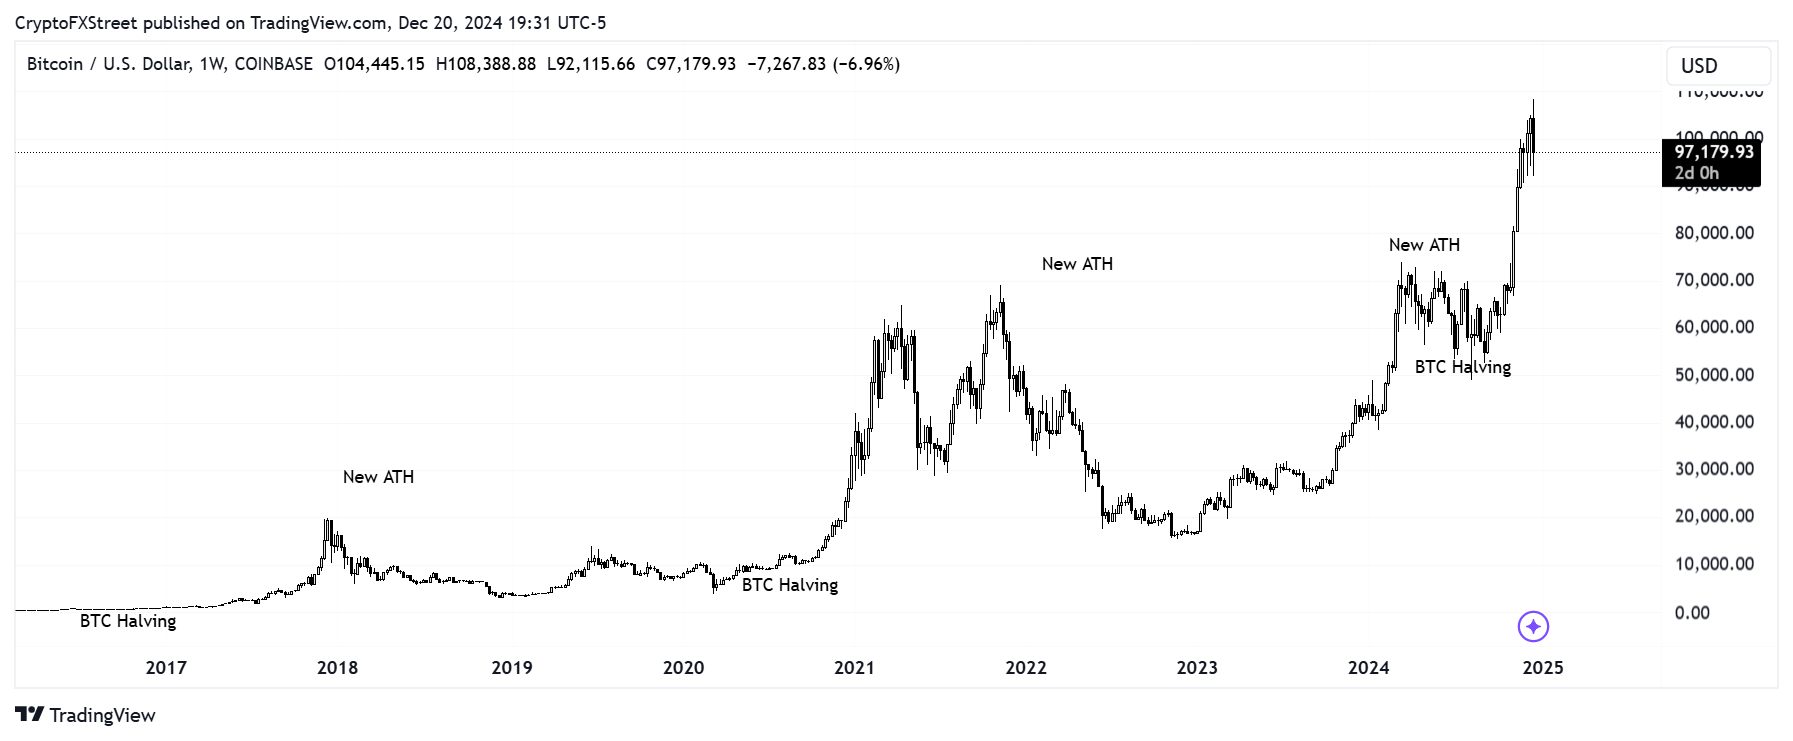
BTC/USD weekly chart (Coinbase)
Bitcoin ETFs may have tweaked crypto market structure
The spot Bitcoin ETFs have been instrumental in Bitcoin's price performance since their approval in January, drawing in massive institutional adoption.
These new ETF investors could also alter the dynamic of Bitcoin's market cycle, as evidenced by how they pushed Bitcoin to an all-time high before its latest halving.
Unlike traditional crypto investors who operate in high-volatility environments, institutional investors using ETFs benefit from operational efficiency and reduced custody risks. This is a key factor to watch as bulls and bears struggle to determine the next price direction.
AVIV Ratio still below peak points
Despite fears of a market top, Glassnode's AVIV metric shows that Bitcoin still has room to grow. The AVIV Ratio measures the average unrealized profit, or paper gains, held by active investors in the market.
According to Glassnode analysts, bull markets end when most investors are highly profitable, creating excess supply and a shortage of buyers. The metric has yet to reach the peak of previous cycles, suggesting that investors have yet to begin taking extreme profits as prices rise.
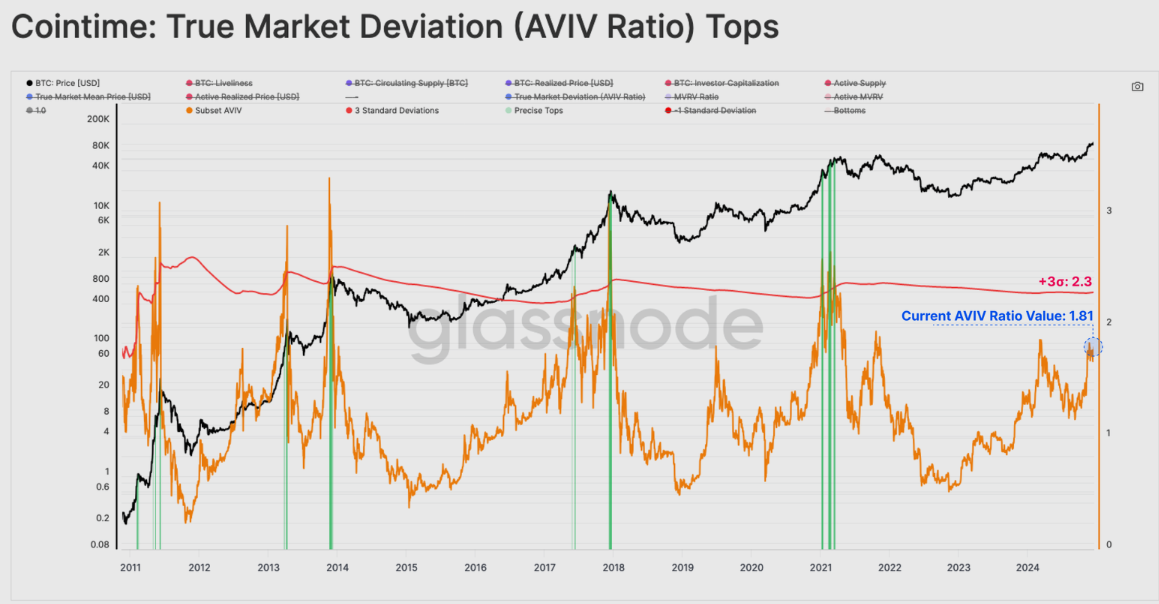
BTC AVIV Glassnode. Source: Glassnode
A similar sentiment was expressed by Michael Nadeau in The DeFi Report, suggesting that the dip in Bitcoin's price is a necessary pullback. He expects a short-term consolidation before the market resumes its upward trajectory.
Likewise, Santiment data reveals that the buy-the-dip trend among market participants has risen to its highest level in 8 months, signaling increased enthusiasm toward a market recovery.
With Bitcoin falling as low as $95.5K today, the ratio of crypto discussions that are about buying crypto's dip has reached its highest level in over 8 months. The last time we saw the crowd nearly this enthusiastic about dip buying was the major crash on August 4th. Since… pic.twitter.com/39NlpnGMCs
— Santiment (@santimentfeed) December 20, 2024
Anticipation for pro-crypto Trump entering office
The bullish sentiment surrounding US President-elect Donald Trump's upcoming administration could also be a catalyst to ensure Bitcoin completes its cycle by reaching new highs in 2025. Much of the positive sentiment is driven by anticipated regulatory changes favoring digital assets coupled with Securities & Exchange Commission (SEC) Chair Gary Gensler's resignation on January 20.
Author

Michael Ebiekutan
FXStreet
With a deep passion for web3 technology, he's collaborated with industry-leading brands like Mara, ITAK, and FXStreet in delivering groundbreaking reports on web3's transformative potential across diverse sectors. In addition to


