Bitcoin Cash Price Forecast: BCH breakout hits pause, bulls aim for $260
- Bitcoin Cash breaks out of a parallel descending channel but hits pause slightly above $240.
- BCH/USD is expected to resume the uptrend to $260, as highlighted by on-chain analysis.

The cryptocurrency market squeeze finally reached its elastic limit over the weekend. Trading yielded for most of the digital assets led by the flagship cryptocurrency, Bitcoin. Bitcoin Cash (BCH) built an uptrend on the support established at $220. The price action extended marginally above $240 before the breakout stalled. BCH/USD is trading at $239 at the time of writing, following a minor retreat.
Bitcoin Cash retreat in the offing
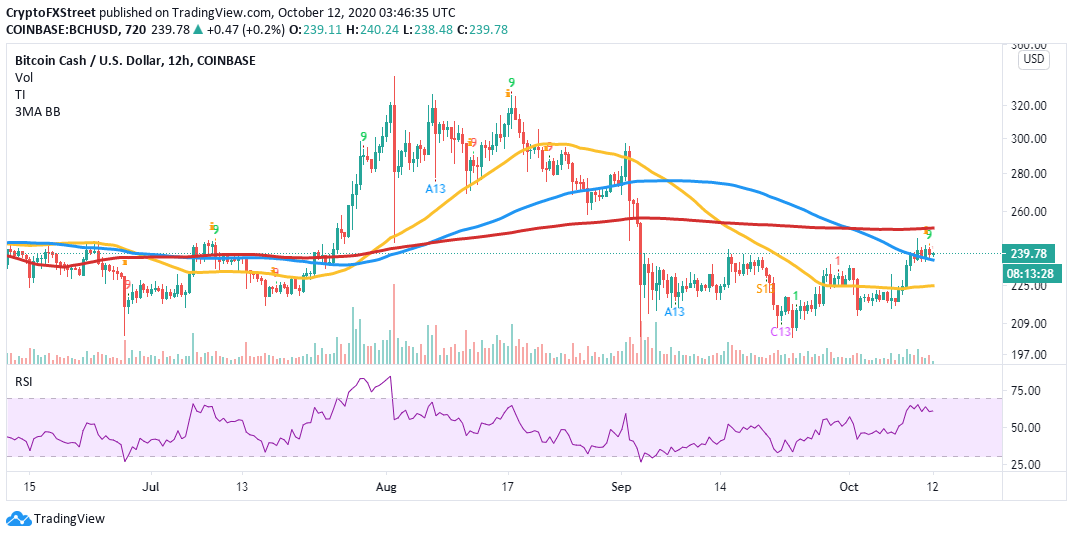
The 50-day Simple Moving Average (SMA) providing initial support. Besides, the hurdle at $240, the 200-day SMA limits upside action, delaying the much-anticipated breakout to $260. Despite the spike above a descending channel, BCH bulls appear to have lost the steam. According to the Relative Strength Index (RSI), the barrier at $240 seems temporary because the bullish price action is expected to continue in the near term.
BCH/USD daily chart
-637380718949538631.png)
The TD Sequential indicator presents a sell signal in the form of a green nine candlestick in the 12-hour timeframe. In other words, BCH/USD could embark on a spiral, mostly if the 100 Simple Moving Average support is shattered. The next rendezvous will be $225, support established by the 50 SMA. The sell signal could be invalidated if BCH holds above the 100 SMA and reclaims the ground beyond $240.
BCH/USD 12-hour chart
IntoTheBlock’s IOMAP model reveals the presence of minor resistance towards $260. However, outlook will gain more credence if the seller congestion in the range between $243 and $250 is brought down. Here, 48,800 addresses previously purchased 545,000 BCH. Note that price action past $260 will encounter other minor hurdles.
BCH IOMAP chart
-637380719636564901.png)
On the downside, Bitcoin Cash is holding above areas of immense support. It is doubtful that BCH will resume the downtrend, as highlighted by the model. The most robust support lies between $227 and $233. Here, 112,000 addresses previously purchased 1.3 million BCH.
Looking at the other side of the fence
It is worth mentioning that Bitcoin Cash could resume the downtrend sabotaging the expected gains towards $260. The TD Sequential indicator flashed a sell signal on the 12-hour chart, awaiting validation by a break below the 100 SMA. Declines below the 100 SMA could test support at $225, as highlighted by the 50 SMA. Simultaneously the RSI in the 12-hour range supports the bearish outlook following a rejection at 65.
Author

John Isige
FXStreet
John Isige is a seasoned cryptocurrency journalist and markets analyst committed to delivering high-quality, actionable insights tailored to traders, investors, and crypto enthusiasts. He enjoys deep dives into emerging Web3 tren


