Top Crypto Gainers: Canton slows, Toncoin and Lido DAO rally further
- Canton takes a breather after a 23% rally on Sunday, risking the three-day rally.
- Toncoin rises 1% on Monday, marking its eighth consecutive day of uptrend.
- Lido DAO is up nearly 2%, extending the breakout of a descending wedge pattern.

Canton (CC), Toncoin (TON), and Lido DAO (LDO) emerge as top gainers in a broadly slow cryptocurrency market over the last 24 hours. Canton ticks lower on Monday after a three-day rally while Toncoin and Lido DAO extend gains.
Canton pauses Sunday’s 23% surge
Canton is down 4% at press time on Monday, starting the week on a bearish note after a 23% jump on Sunday. The pullback after three days of uptrend risks a retest of the centre Pivot Point at $0.1215 on the 4-hour chart, followed by the $0.1000 psychological mark.
However, the momentum indicators on the 4-hour chart indicate heightened buying pressure. The Relative Strength Index (RSI) at 73 signals an overbought condition, while the Moving Average Convergence Divergence (MACD) moves upward, accompanied by green histogram bars.
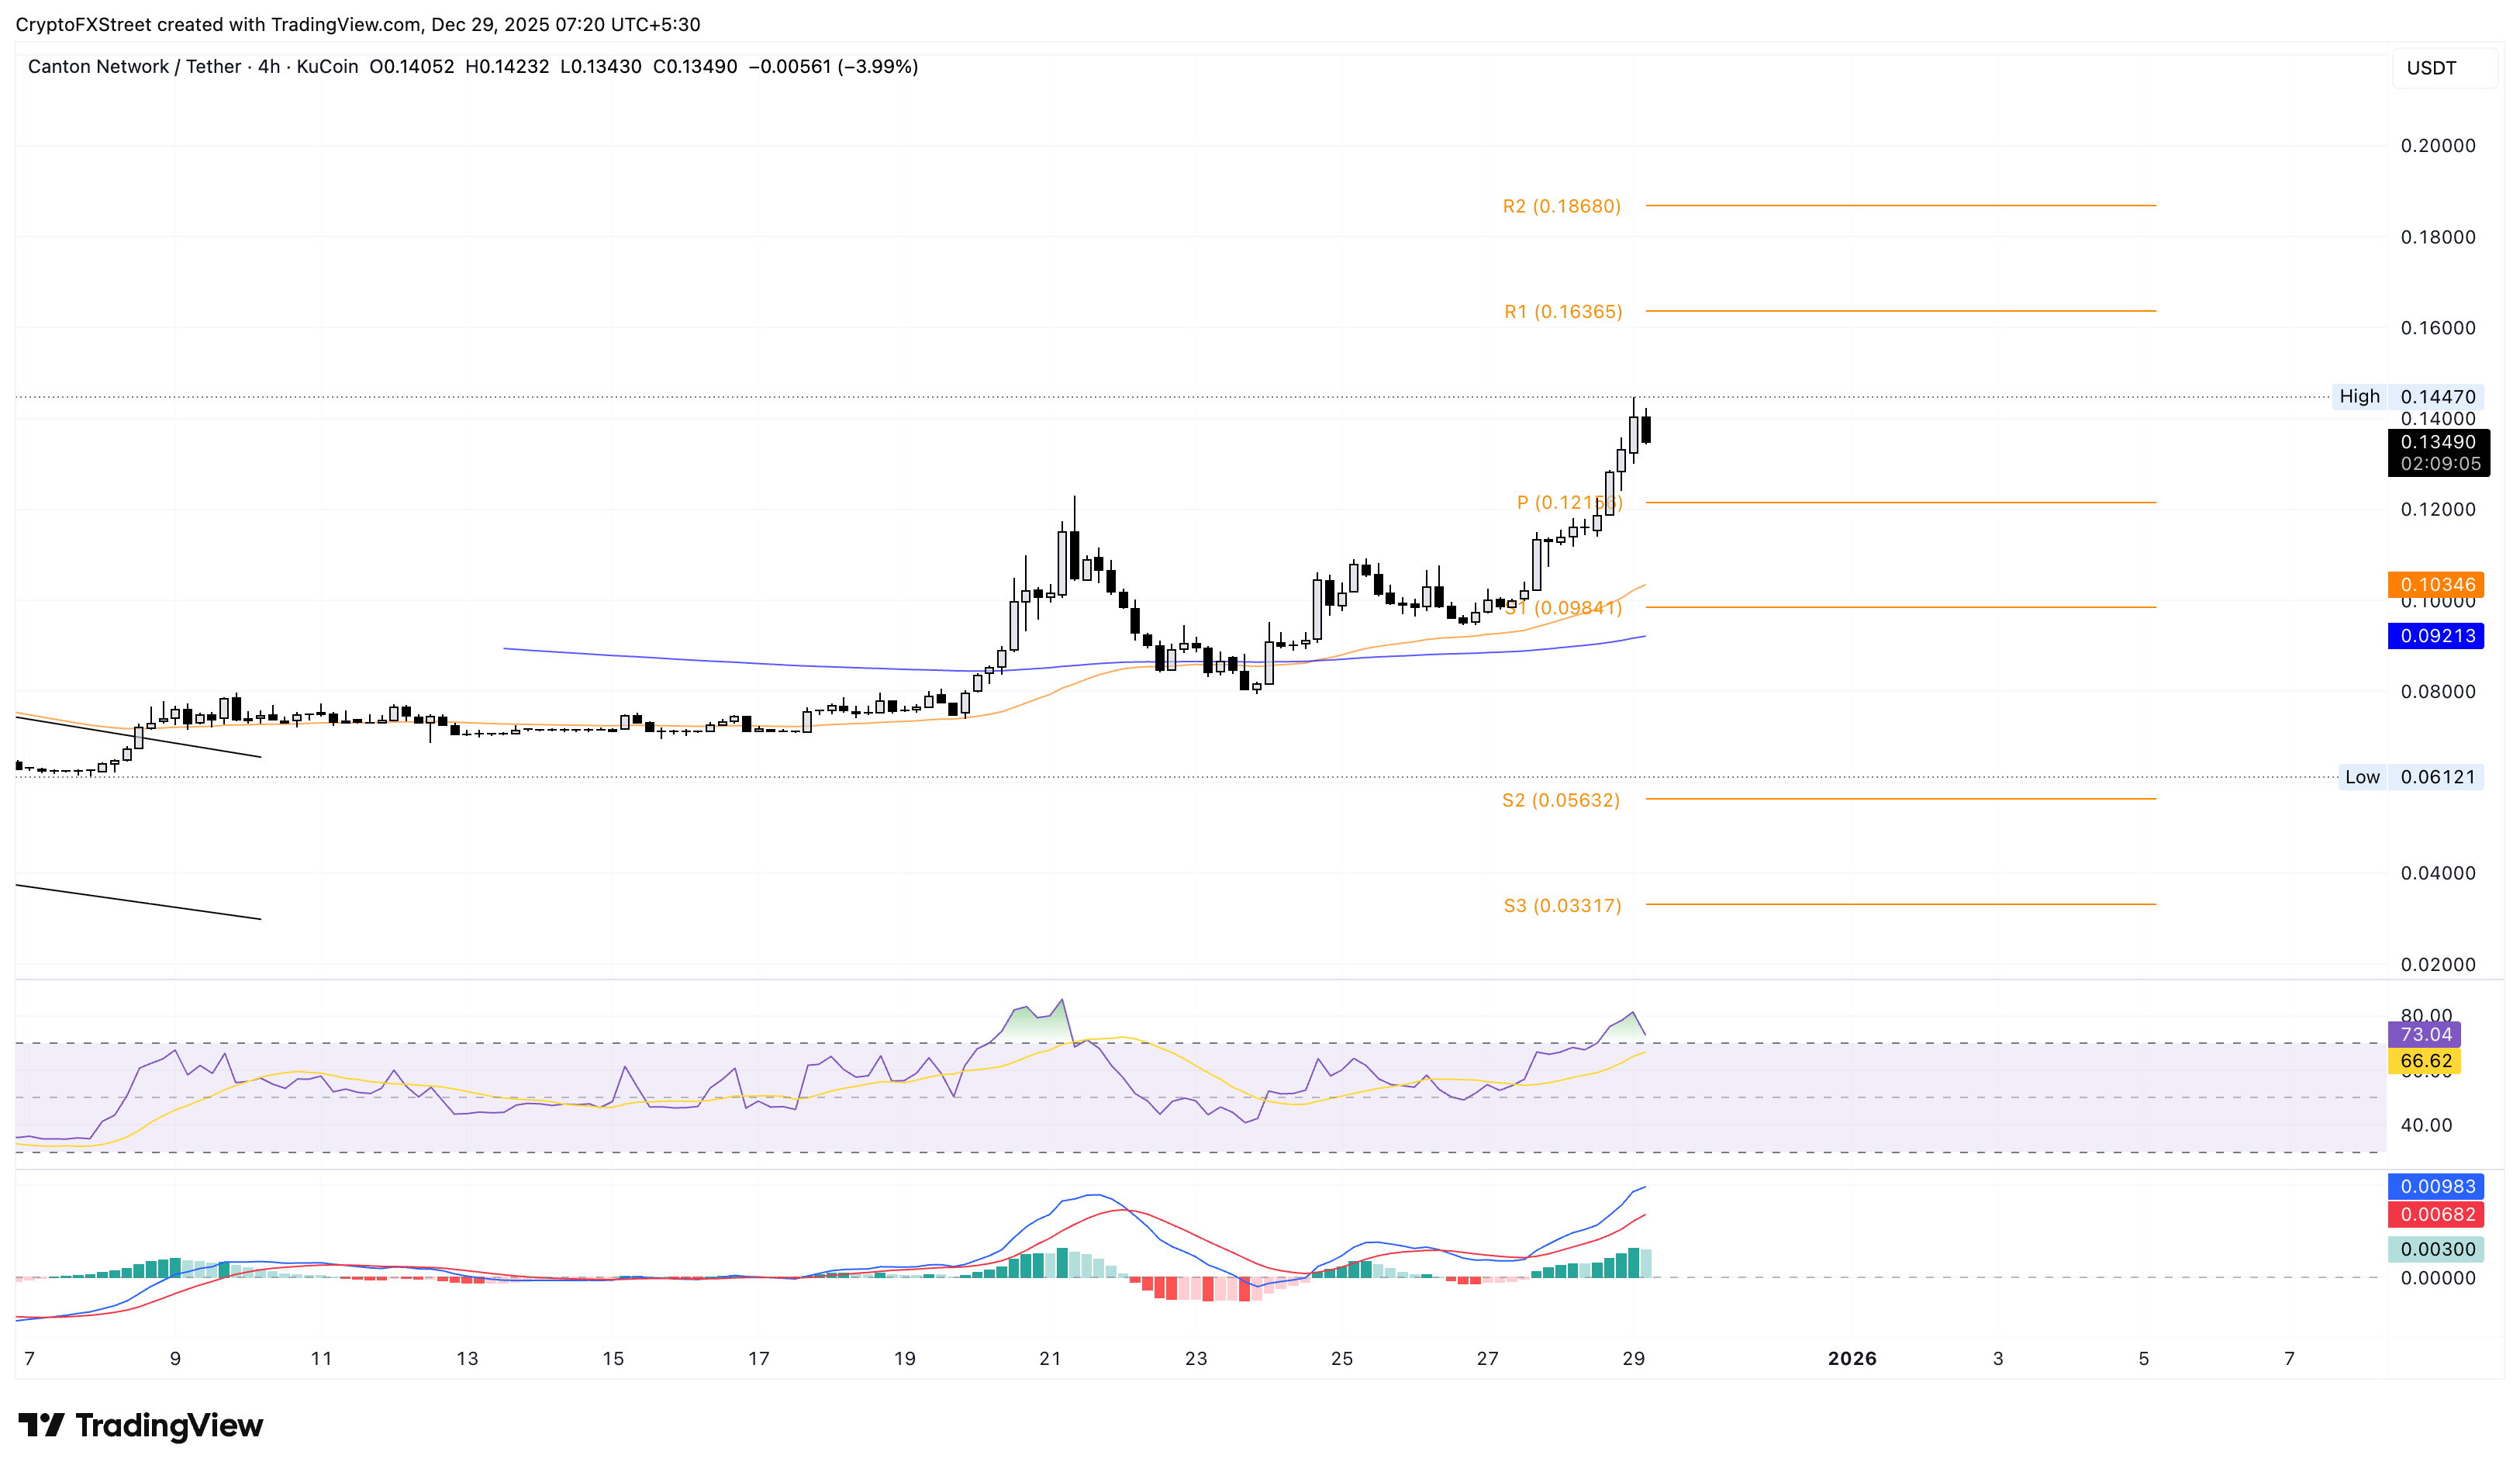
Looking up, a potential recovery in Canton could target the R1 Pivot Point at $0.1636.
Toncoin’s renewed uptrend targets the 50-day EMA
Toncoin extends the upward trend for the eighth straight day, approaching its 50-day Exponential Moving Average (EMA) near $1.69. At the time of writing, TON recorded a 1% gain on Monday, with bulls aiming to exceed the 50-day EMA and target the R1 Pivot Point at $1.79 on the daily chart.
The RSI at 59 continues to rise above the halfway line, indicating a surge in buying pressure. At the same time, the MACD and signal line extend toward the zero line, suggesting that bullish momentum is strengthening.
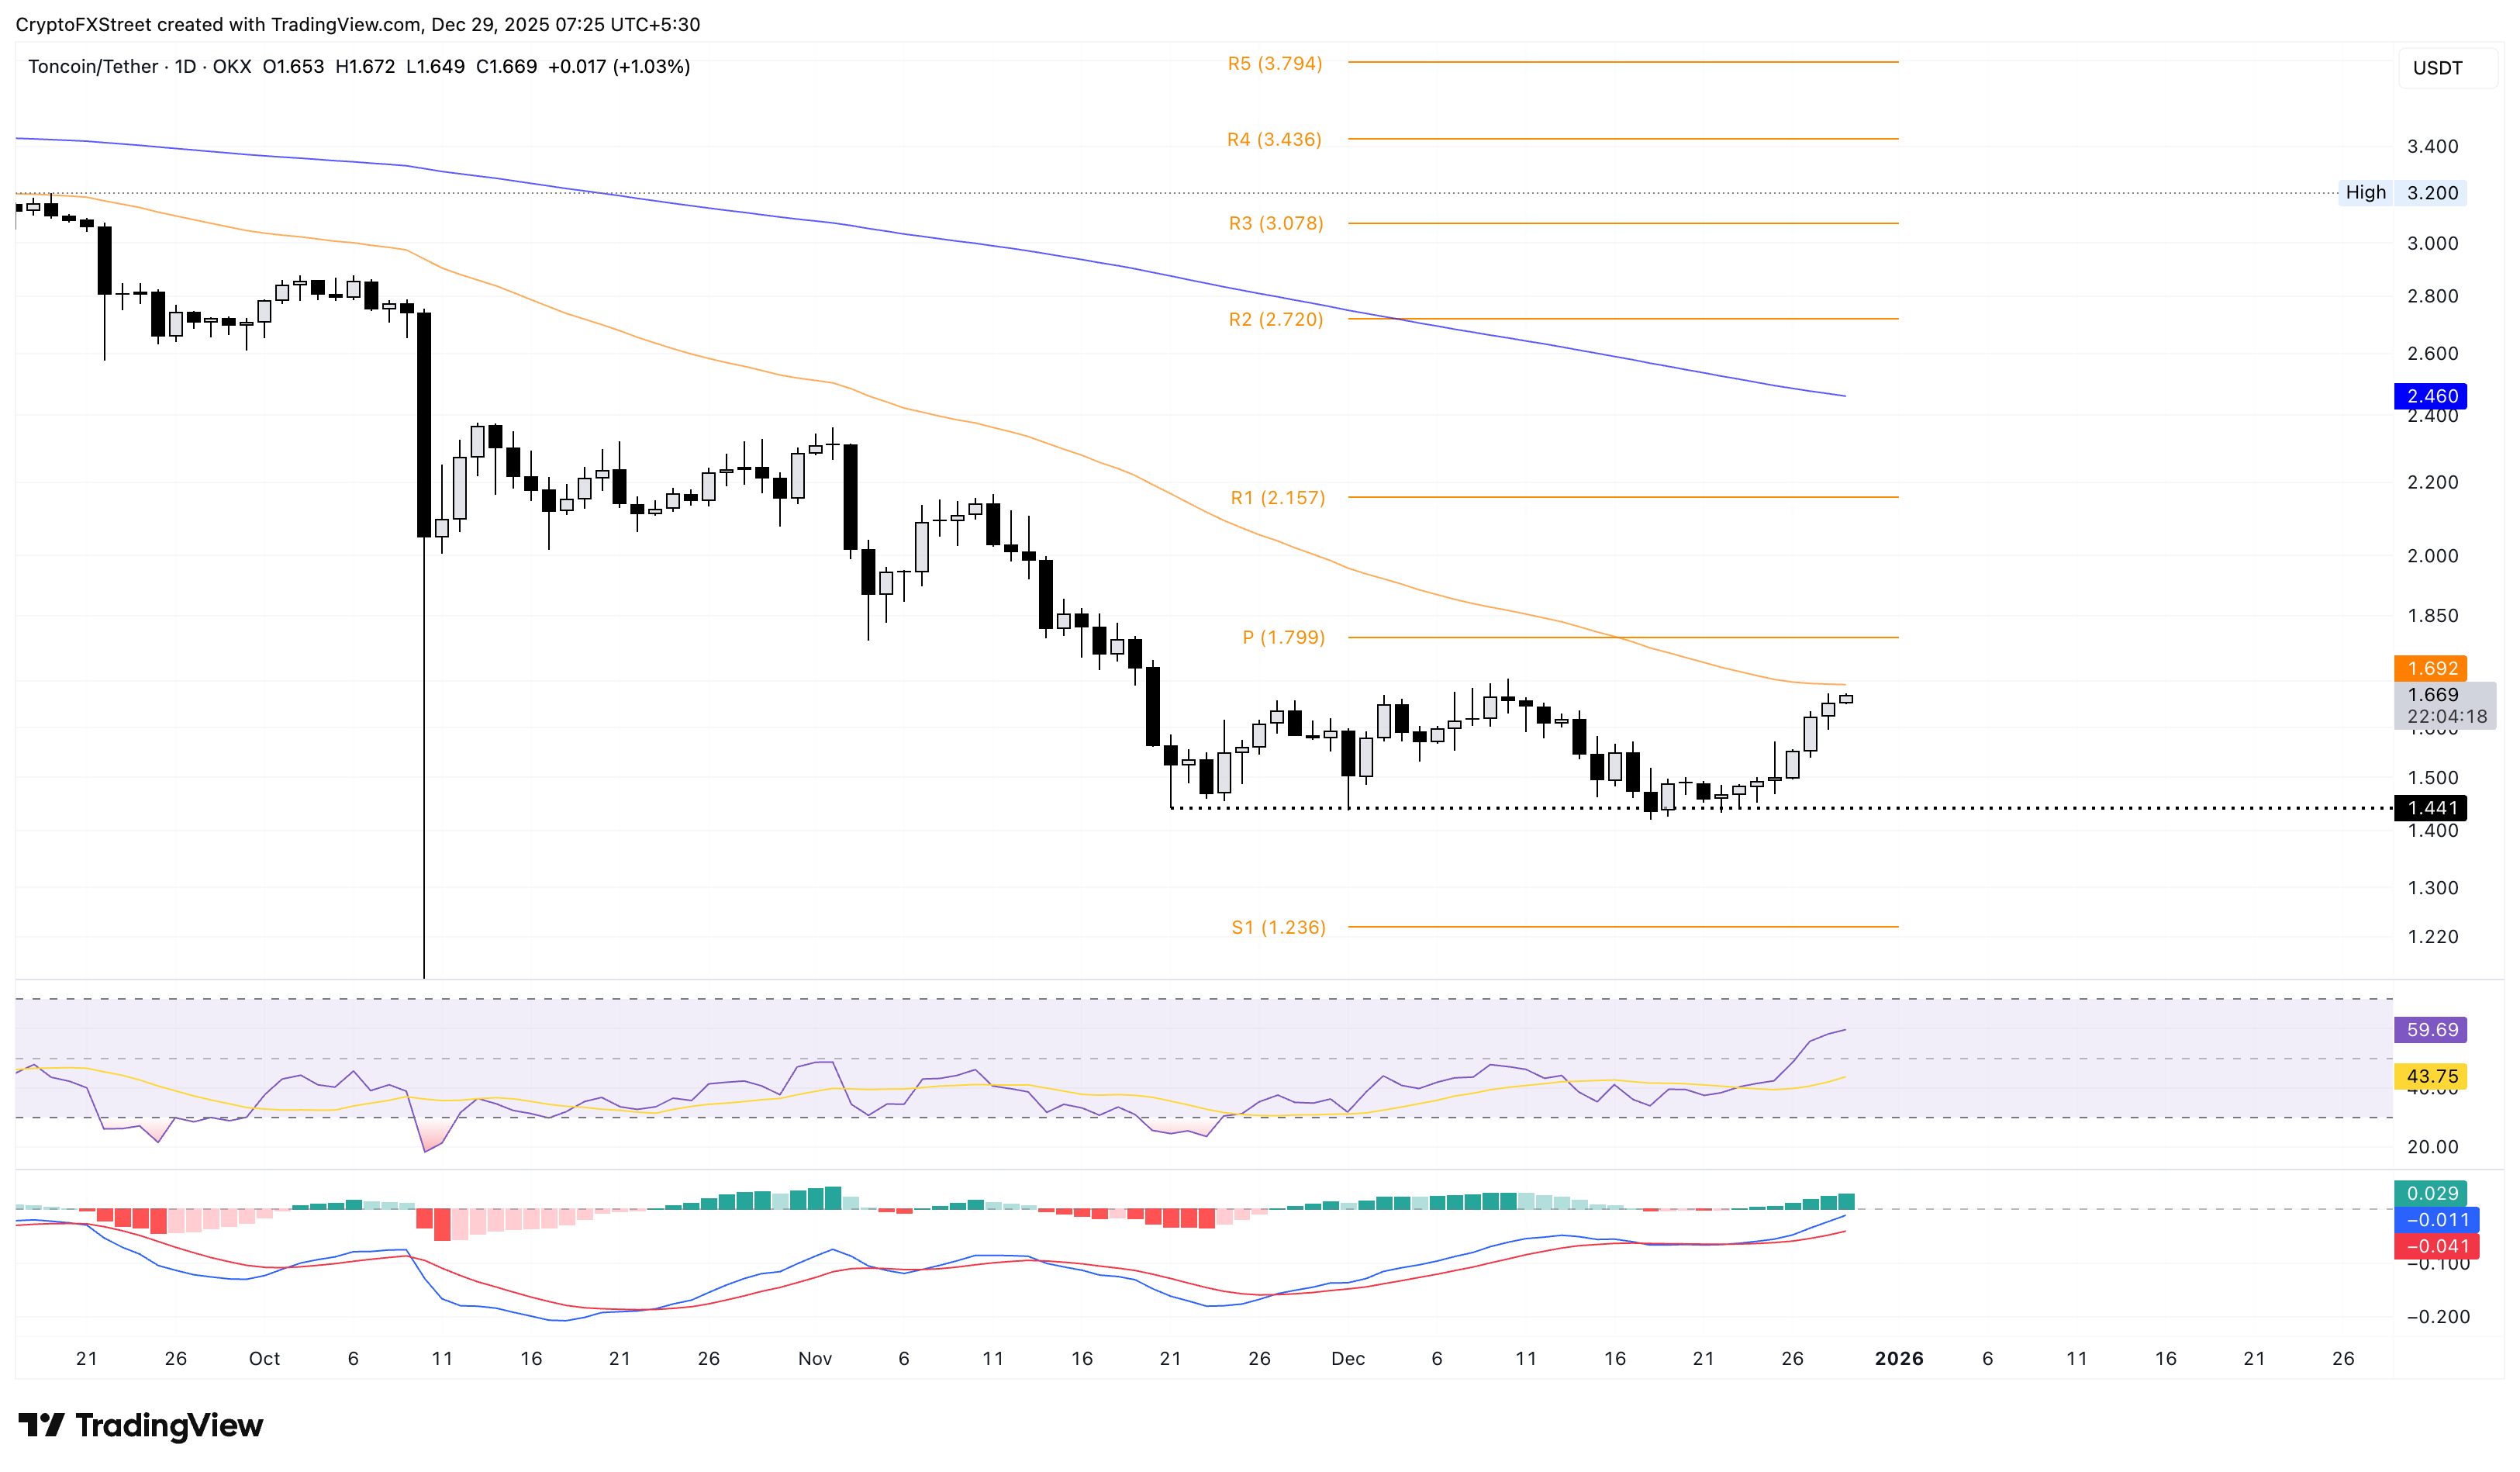
If TON reverses from $1.69, it could retest the $1.444 support level, which has remained intact since November 21.
Lido DAO’s recovery breaks out a falling wedge pattern
Lido DAO records over 1% rise at press time on Monday, marking its sixth consecutive day of gains. The LDO token marked the breakout of a descending wedge pattern on Sunday, targeting the 50-day EMA at $0.6431.
If LDO exceeds this moving average, it could aim for the R1 Pivot Point at $0.7194.
The RSI at 52 crosses above the halfway line, indicating renewed buying pressure, while the MACD and signal line continue to trend upward toward the zero line.
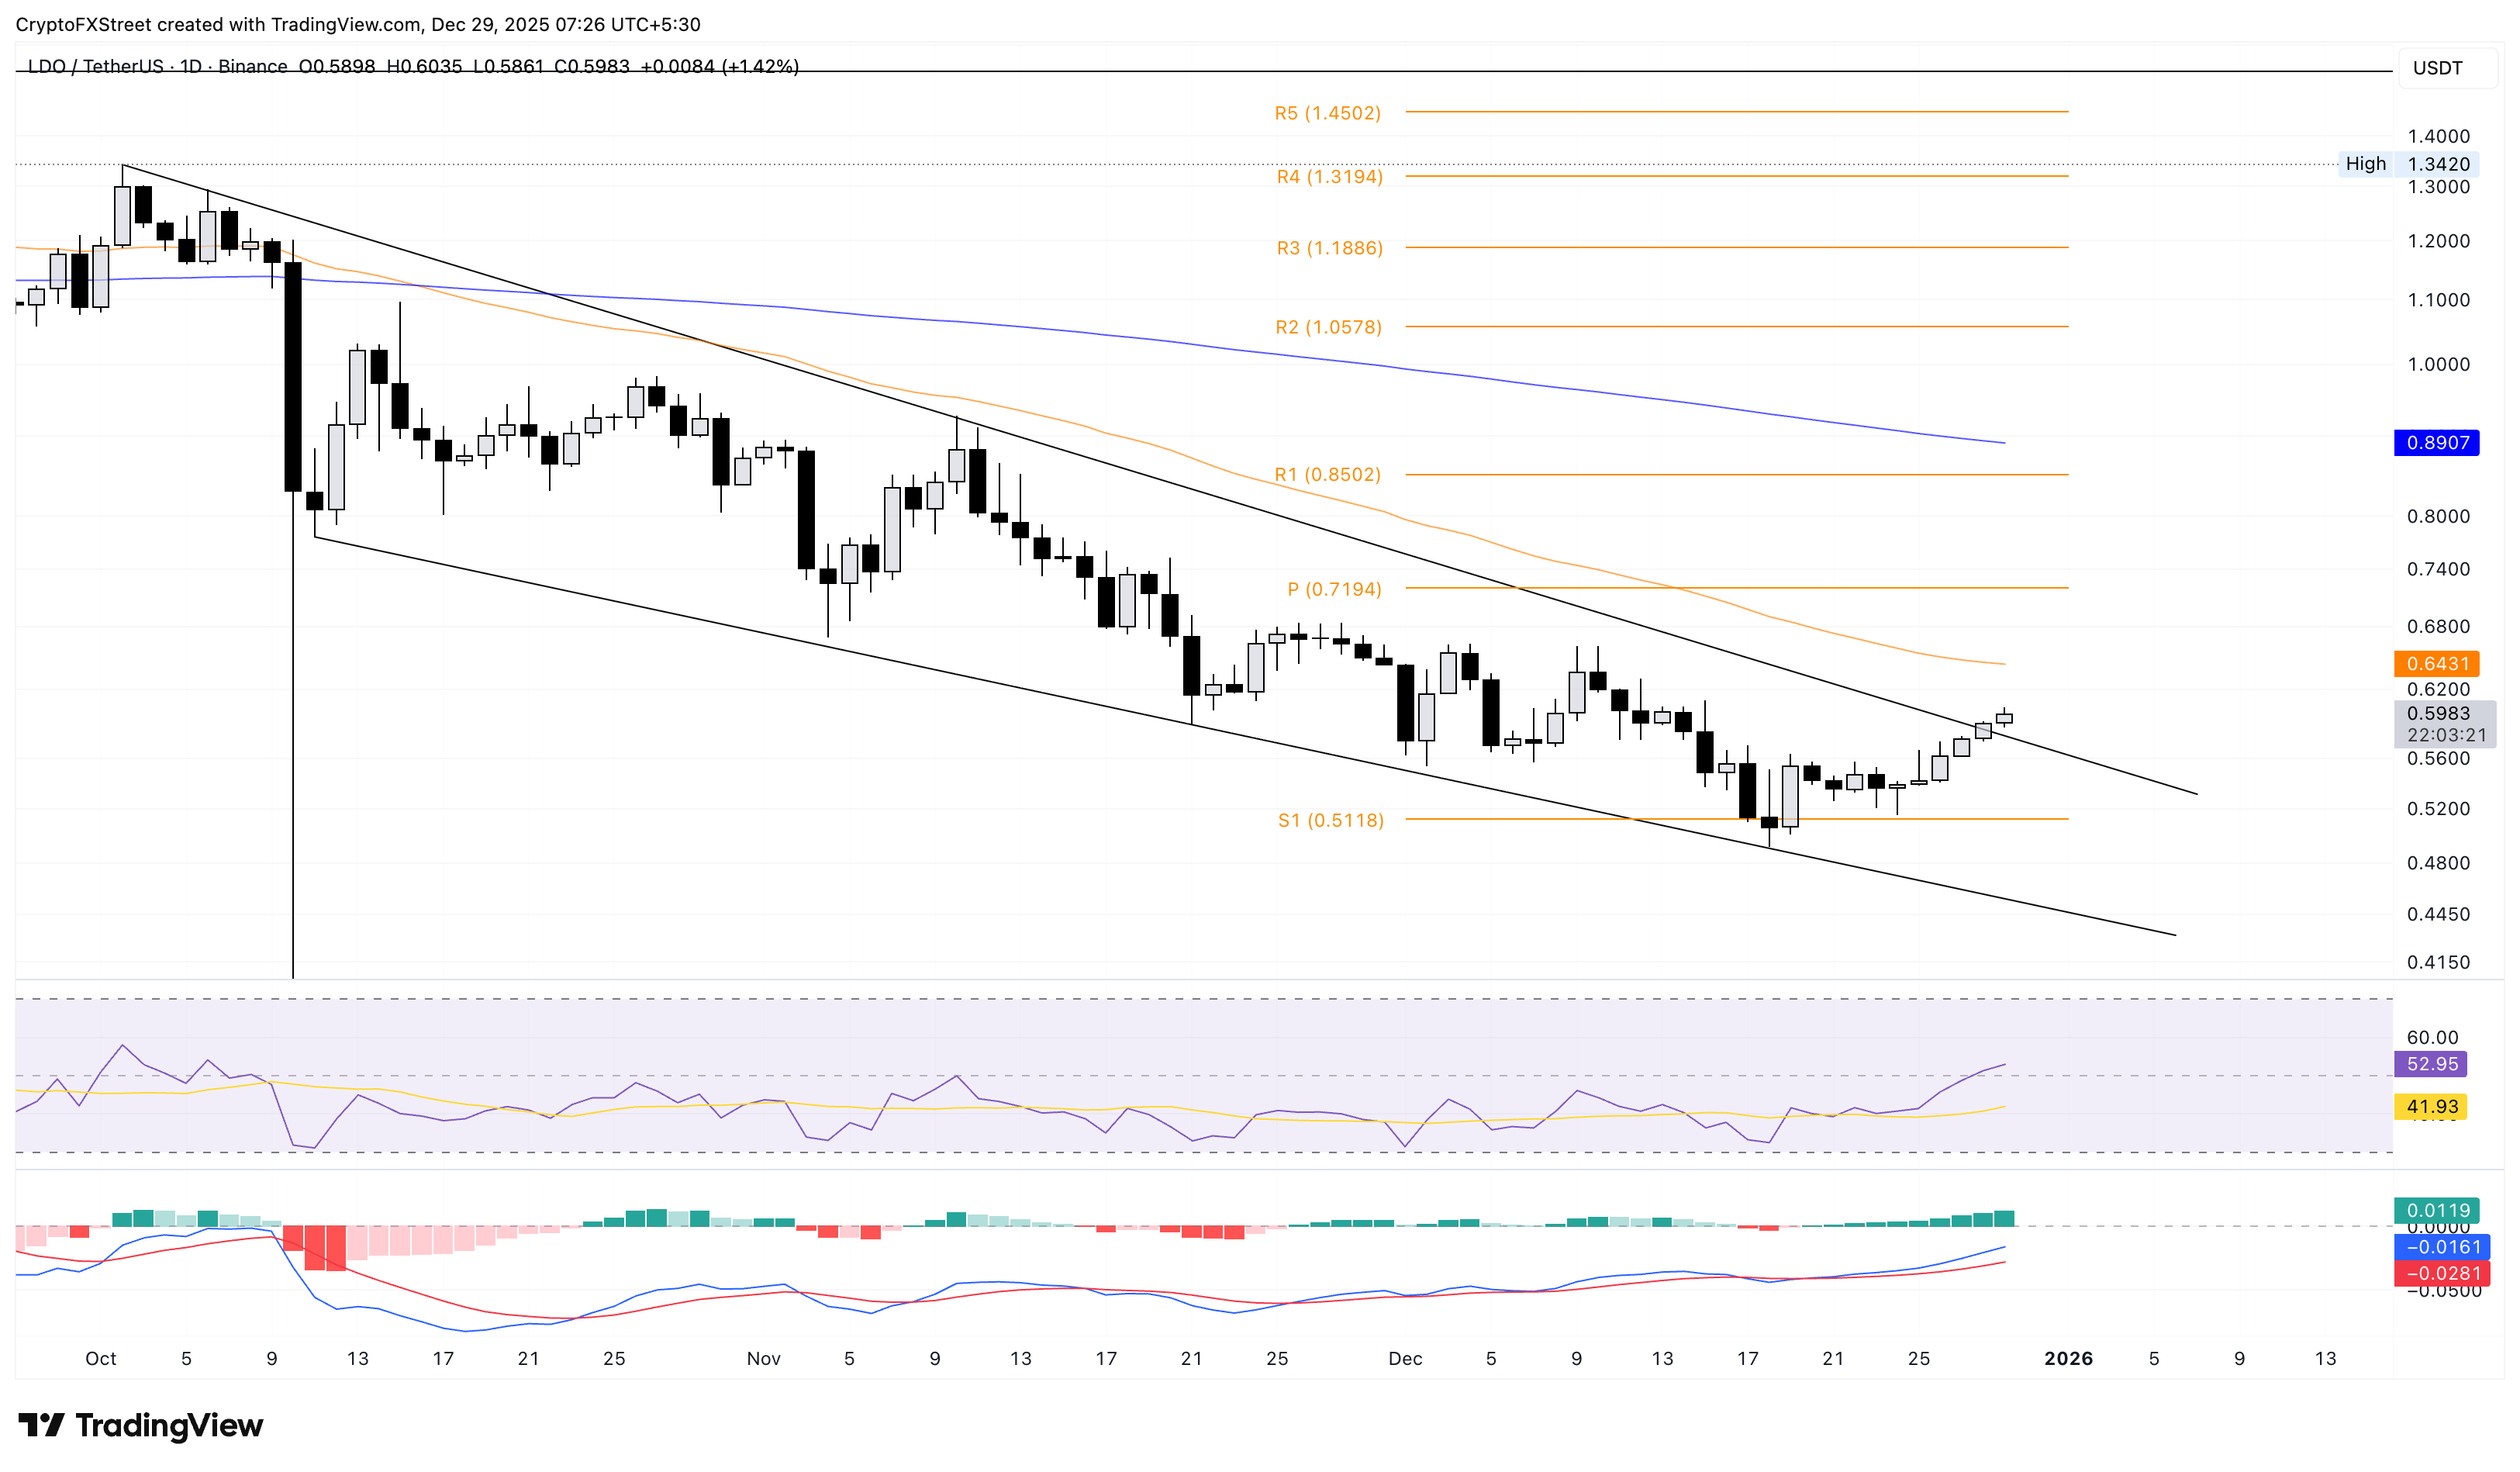
If LDO slips below Sunday’s low at $0.5743, it could nullify the wedge pattern breakout, risking a potential drop to the S1 Pivot Point at $0.5118.
Author

Vishal Dixit
FXStreet
Vishal Dixit holds a B.Sc. in Chemistry from Wilson College but found his true calling in the world of crypto.




