|

Bitcoin Price Analysis: BTC/USD eyes $12K amid a potential symmetrical triangle breakout

  • BTC /USD hits fresh five-week highs to test $11,500 levels.
  • A symmetrical triangle spotted on the daily chart.
  • A daily closing above $11,080 key for additional upside.

Bitcoin (BTC/USD) is on a track to book four straight days of gains this Saturday, amid the upbeat mood seen across the crypto space. The most favorite crypto coin trades close to the highest levels in five weeks at $11,498, adding 3% so far. Despite the recent rally, some analysts view Bitcoin’s surge as a dead cat bounce or fake-out before substantial declines.  At the press time, Bitcoin enjoys a market capitalization of $210.82 billion.

Technical Outlook

BTC/USD: Daily chart

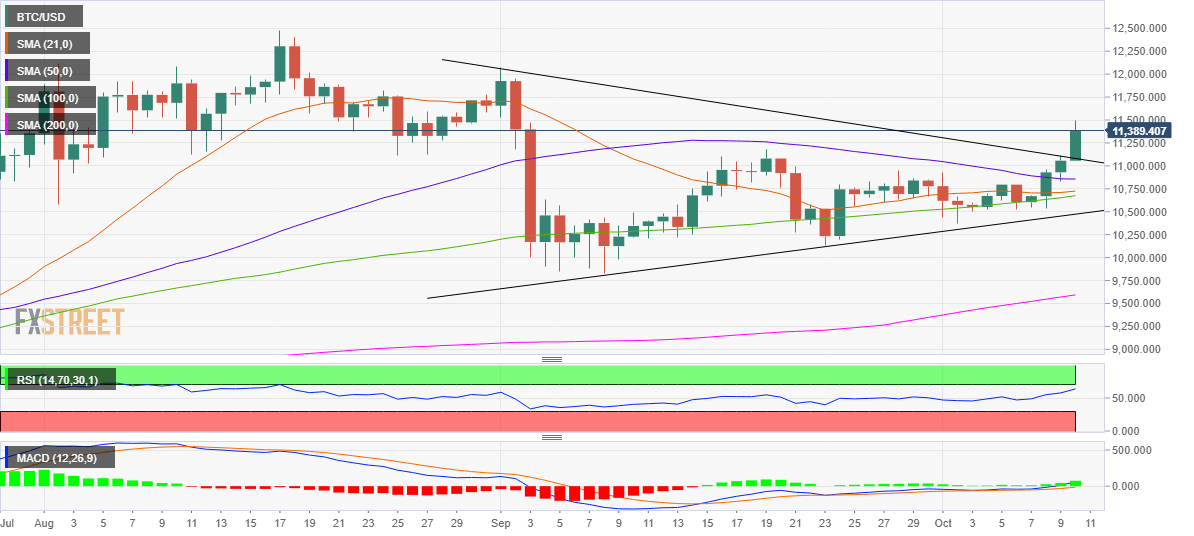
As observed on the daily chart, BTC/USD has carved out a potential symmetrical triangle breakout, with the bullish formation likely to be confirmed only a daily closing above the falling trendline resistance at $11,080.

The 14-day Relative Strength Index (RSI) points north while trending below the overbought territory, suggesting that there is more room to the upside. Adding credence to the positive bias, the MACD has formed a strong bullish bar on Saturday.

The price has recaptured all the key Daily Moving Averages (DMA), backing the bullish case.

Therefore, the bulls could regain momentum and eye a test of the next critical barrier at the $12K mark before the spot embarks upon its journey to take on the pattern target near $13,300 levels.

Alternatively, any profit-taking declines could confront the former trendline resistance now turned support at 11,080, below which the 50-DMA support at $10,856 could come into play.

The next fierce support awaits around $10,700, which is the convergence of the horizontal 21 and 100-DMAs.

BTC/USD: Additional levels to watch

BTC/USD

Overview
Today last price11388.25
Today Daily Change332.02
Today Daily Change %3.00
Today daily open11056.2
 
Trends
Daily SMA2010691.75
Daily SMA5010858.97
Daily SMA10010652.55
Daily SMA2009570.59
 
Levels
Previous Daily High11111.27
Previous Daily Low10833.62
Previous Weekly High11111.27
Previous Weekly Low10525.58
Previous Monthly High12072.72
Previous Monthly Low9829.75
Daily Fibonacci 38.2%11005.21
Daily Fibonacci 61.8%10939.68
Daily Pivot Point S110889.46
Daily Pivot Point S210722.71
Daily Pivot Point S310611.8
Daily Pivot Point R111167.11
Daily Pivot Point R211278.02
Daily Pivot Point R311444.77

Author

Dhwani Mehta

Dhwani Mehta

FXStreet

Residing in Mumbai (India), Dhwani is a Senior Analyst and Manager of the Asian session at FXStreet. She has over 10 years of experience in analyzing and covering the global financial markets, with specialization in Forex and commodities markets.

More from Dhwani Mehta
Share:

Editor's Picks

Ripple bulls defend key support amid waning retail demand and ETF inflows

XRP ticks up above $1.40 support, but waning retail demand suggests caution. XRP attracts $4 million in spot ETF inflows on Thursday, signaling renewed institutional investor interest.

Crypto Today: Bitcoin, Ethereum, XRP rebound as risk appetite improves

Bitcoin rises marginally, nearing the immediate resistance of $68,000 at the time of writing on Friday. Major altcoins, including Ethereum and Ripple, hold key support levels as bulls aim to maintain marginal intraday gains.

Bitcoin Weekly Forecast: No recovery in sight 

Bitcoin price continues to trade sideways between $65,729 and $71,746, extending its consolidation since February 7. US-spot ETFs record an outflow of $403.90 million through Thursday, pointing to the fifth consecutive week of withdrawals.

Pi Network Price Forecast: PI recovery stalls amid profit-taking

Pi Network tests 50-day EMA support on Friday, after a 5% decline the previous day. PiScan data shows large deposits on CEXs totaling over 4 million PI tokens in the last 24 hours, reflecting an exodus of investors taking profits.

Bitcoin Price Annual Forecast: BTC holds long-term bullish structure heading into 2026

Bitcoin (BTC) is wrapping up 2025 as one of its most eventful years, defined by unprecedented institutional participation, major regulatory developments, and extreme price volatility.

Bitcoin: No recovery in sight

Bitcoin (BTC) price continues to trade within a range-bound zone, hovering around $67,000 at the time of writing on Friday, and falling slightly so far this week, with no signs of recovery.