Meme Coins Price Prediction: Dogecoin, Shiba Inu, Pepe recover, echoing Bitcoin rebound
- Dogecoin is up almost 1% on Monday, tracking Bitcoin's rebound, as derivative traders bet on further gains.
- Shiba Inu hovers near a key resistance level after a nearly 1% rise, while the Supertrend Indicator flashes a buy signal.
- Pepe’s recovery run loses strength amid declining momentum and bullish bets.

Dogecoin (DOGE), Shiba Inu (SHIB), and Pepe (PEPE) are trading mixed as Bitcoin (BTC) records minor gains on Monday, warming sentiment across the broader cryptocurrency market. Still, the incipient recovery in Dogecoin, Shiba Inu, and Pepe remains fragile amid the prevailing downtrend.
Bullish bets surge on meme coins
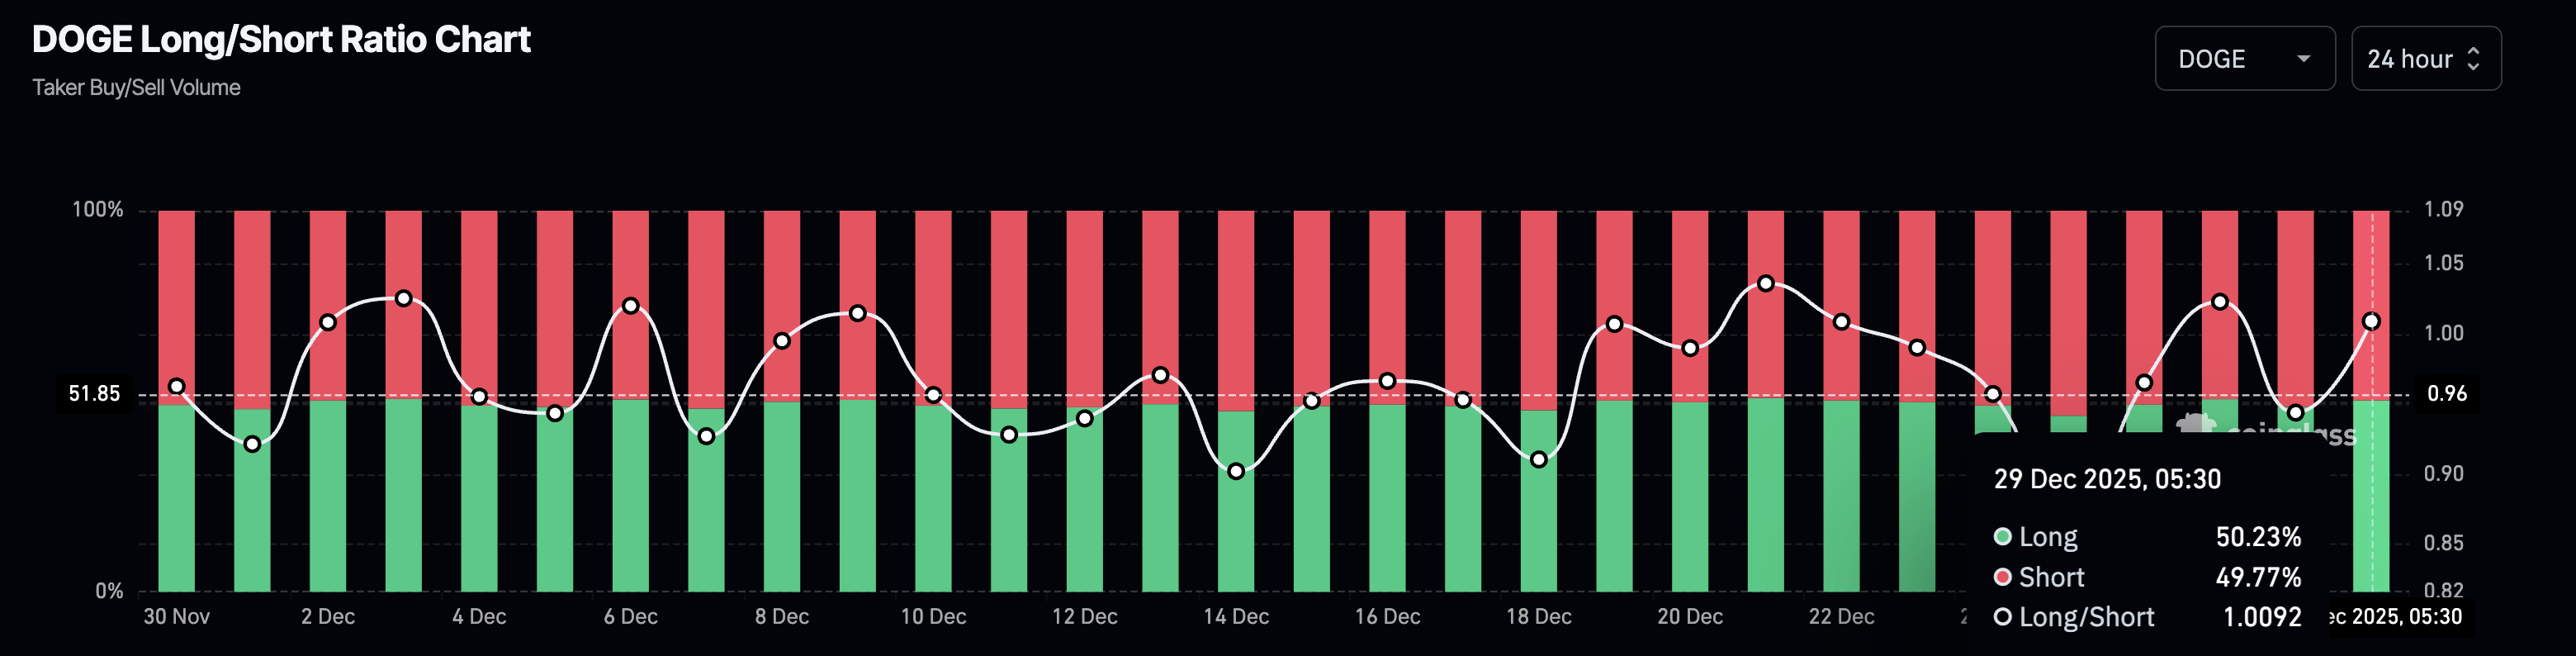
CoinGlass data shows a largely optimistic sentiment toward Dogecoin, Shiba Inu, and Pepe. The long-to-short ratio chart shows that DOGE long positions account for 50.23% of all active positions, up from 47.16% on the previous day. A long positional buildup suggests that traders anticipate further gains.
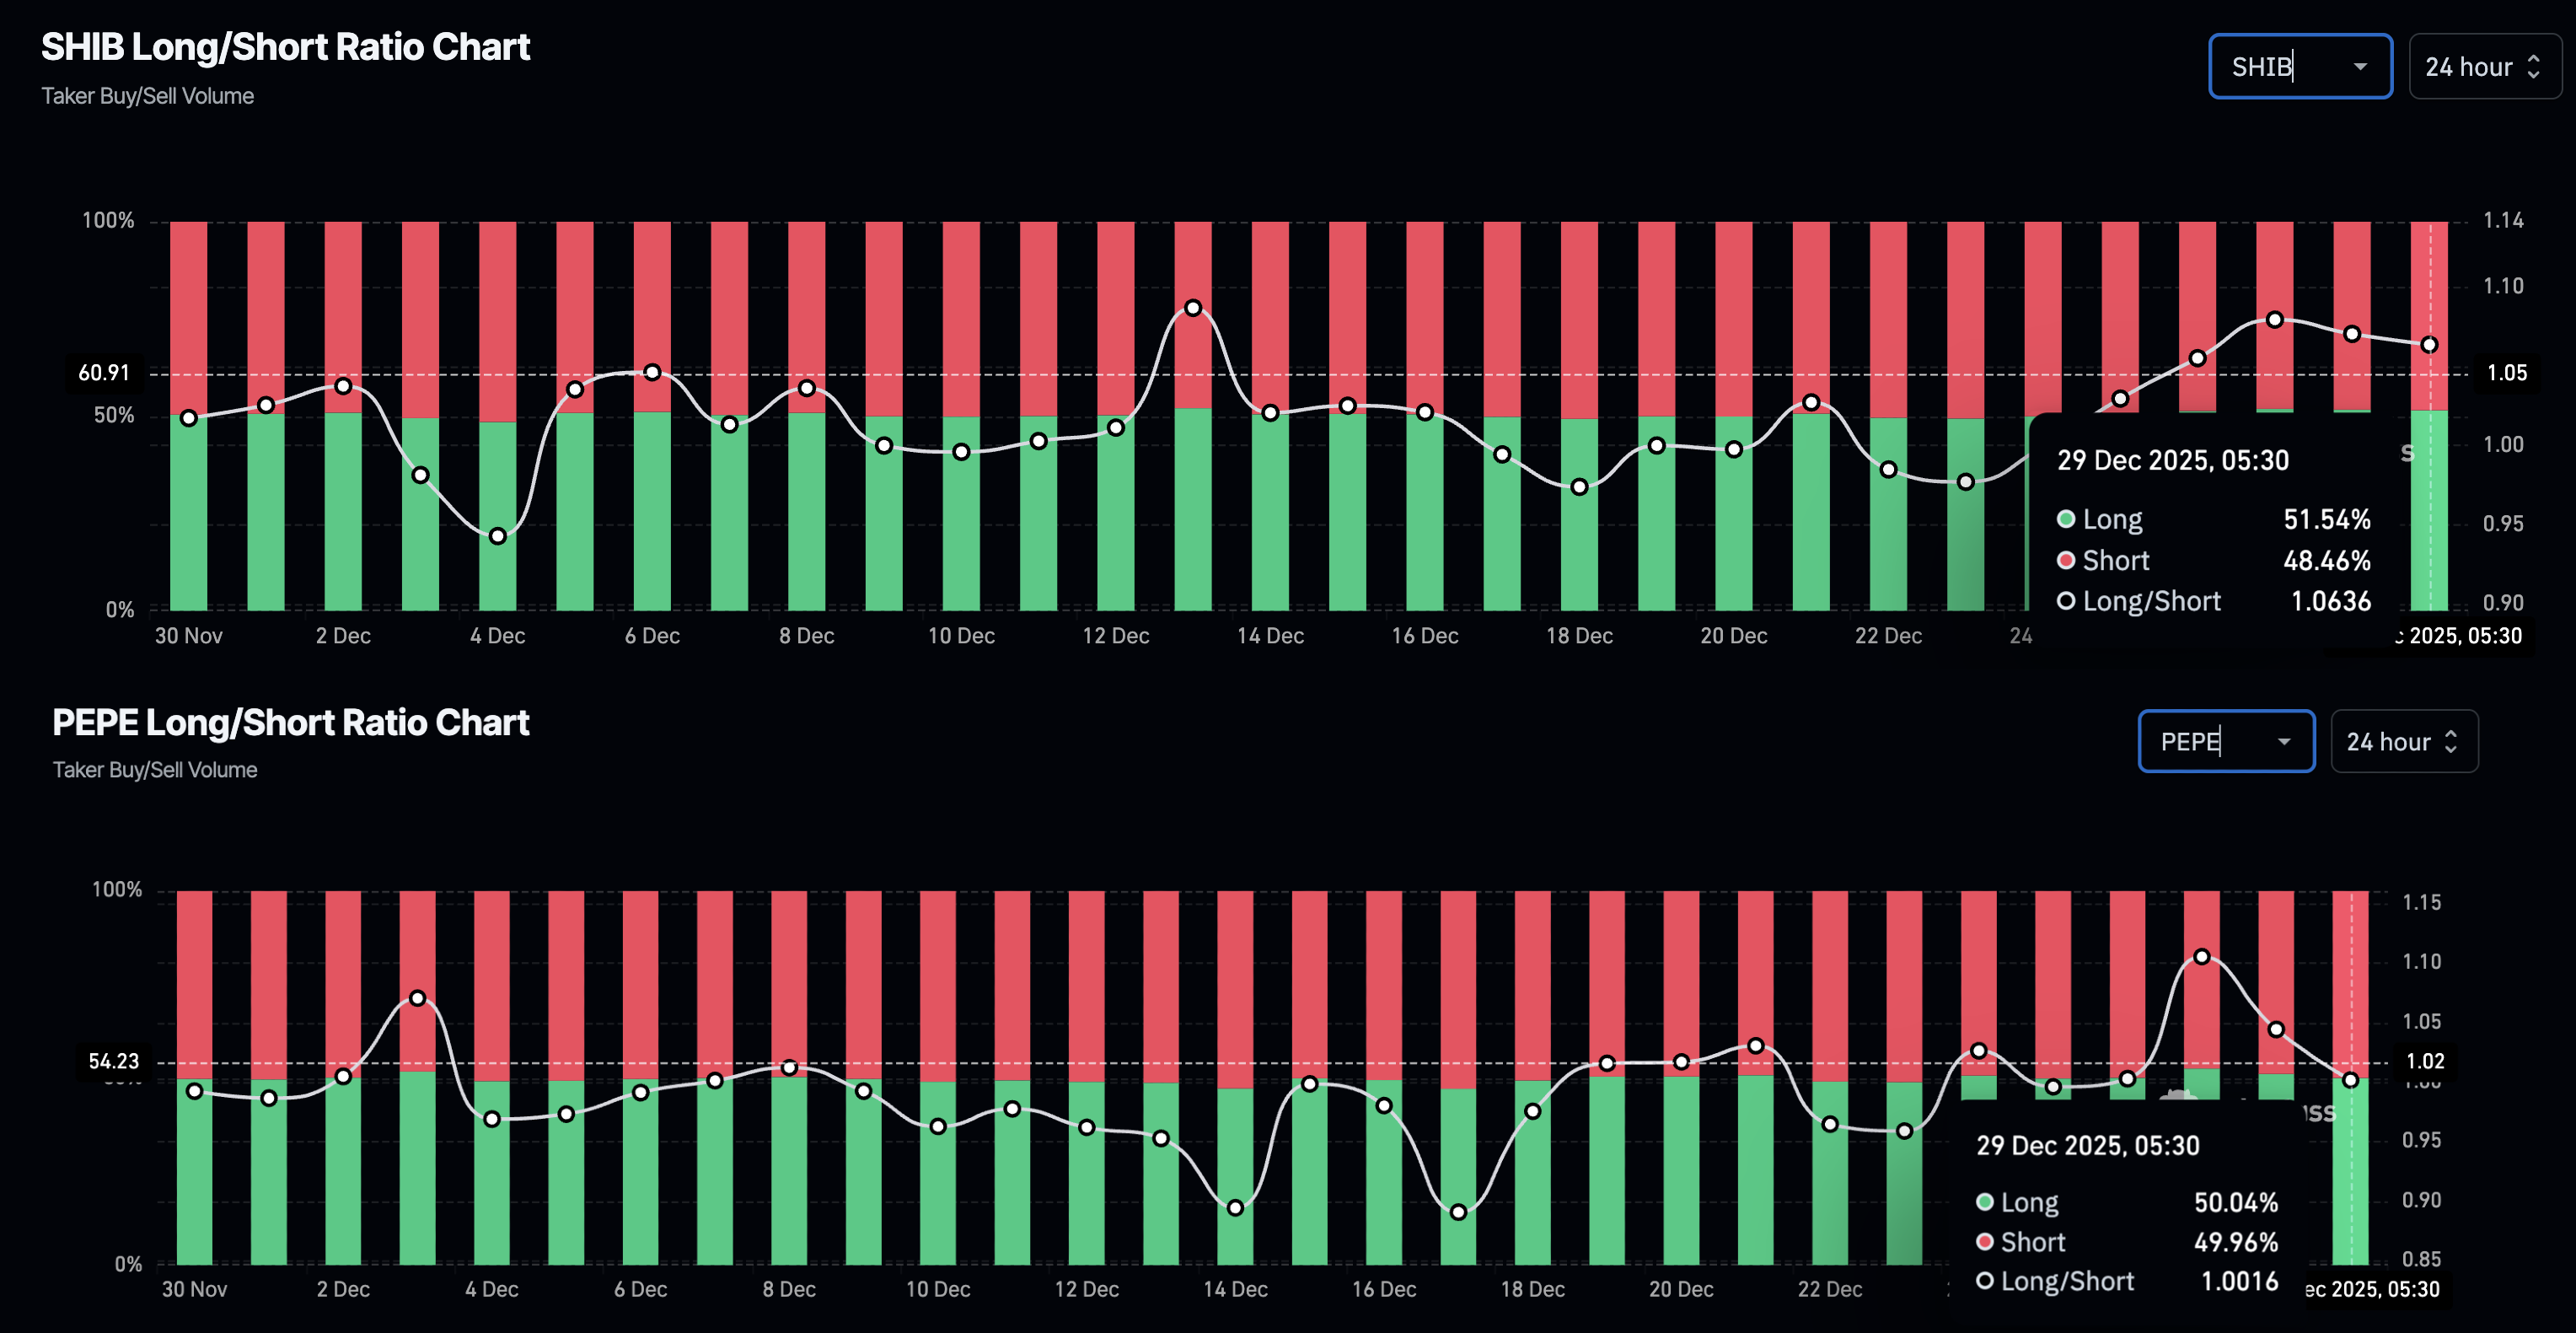
Similarly, long positions account for 51.54% in SHIB derivatives, indicating a buy-side dominance. However, a steep decline of longs in PEPE derivatives to 50.04% from 52.50% on Saturday suggests that traders are losing confidence in the frog-themed meme coin.
Dogecoin inches closer to flipping the bearish trend
Dogecoin ticks higher by almost 1% at press time on Monday, holding above $0.1200. The dog-themed meme coin holds above the centre Pivot Point at $0.1266 and the 50-period Exponential Moving Average (EMA) at $0.1268 on the 4-hour chart.
If DOGE successfully reclaims $0.1300, the Supertrend indicator would trigger a buy signal. In such a case, the R1 Pivot Point at $0.1326 could serve as the immediate resistance for this potential recovery.
The momentum indicators on the 4-hour chart signal a boost in buying pressure. The Relative Strength Index (RSI) at 47 slips below the halfway line, indicating a sudden decline in buying pressure with room on the downside reflecting bearish potential. However, the Moving Average Convergence Divergence (MACD) approaches the zero line, holding its buy signal, which was triggered on Sunday after crossing above the signal line.
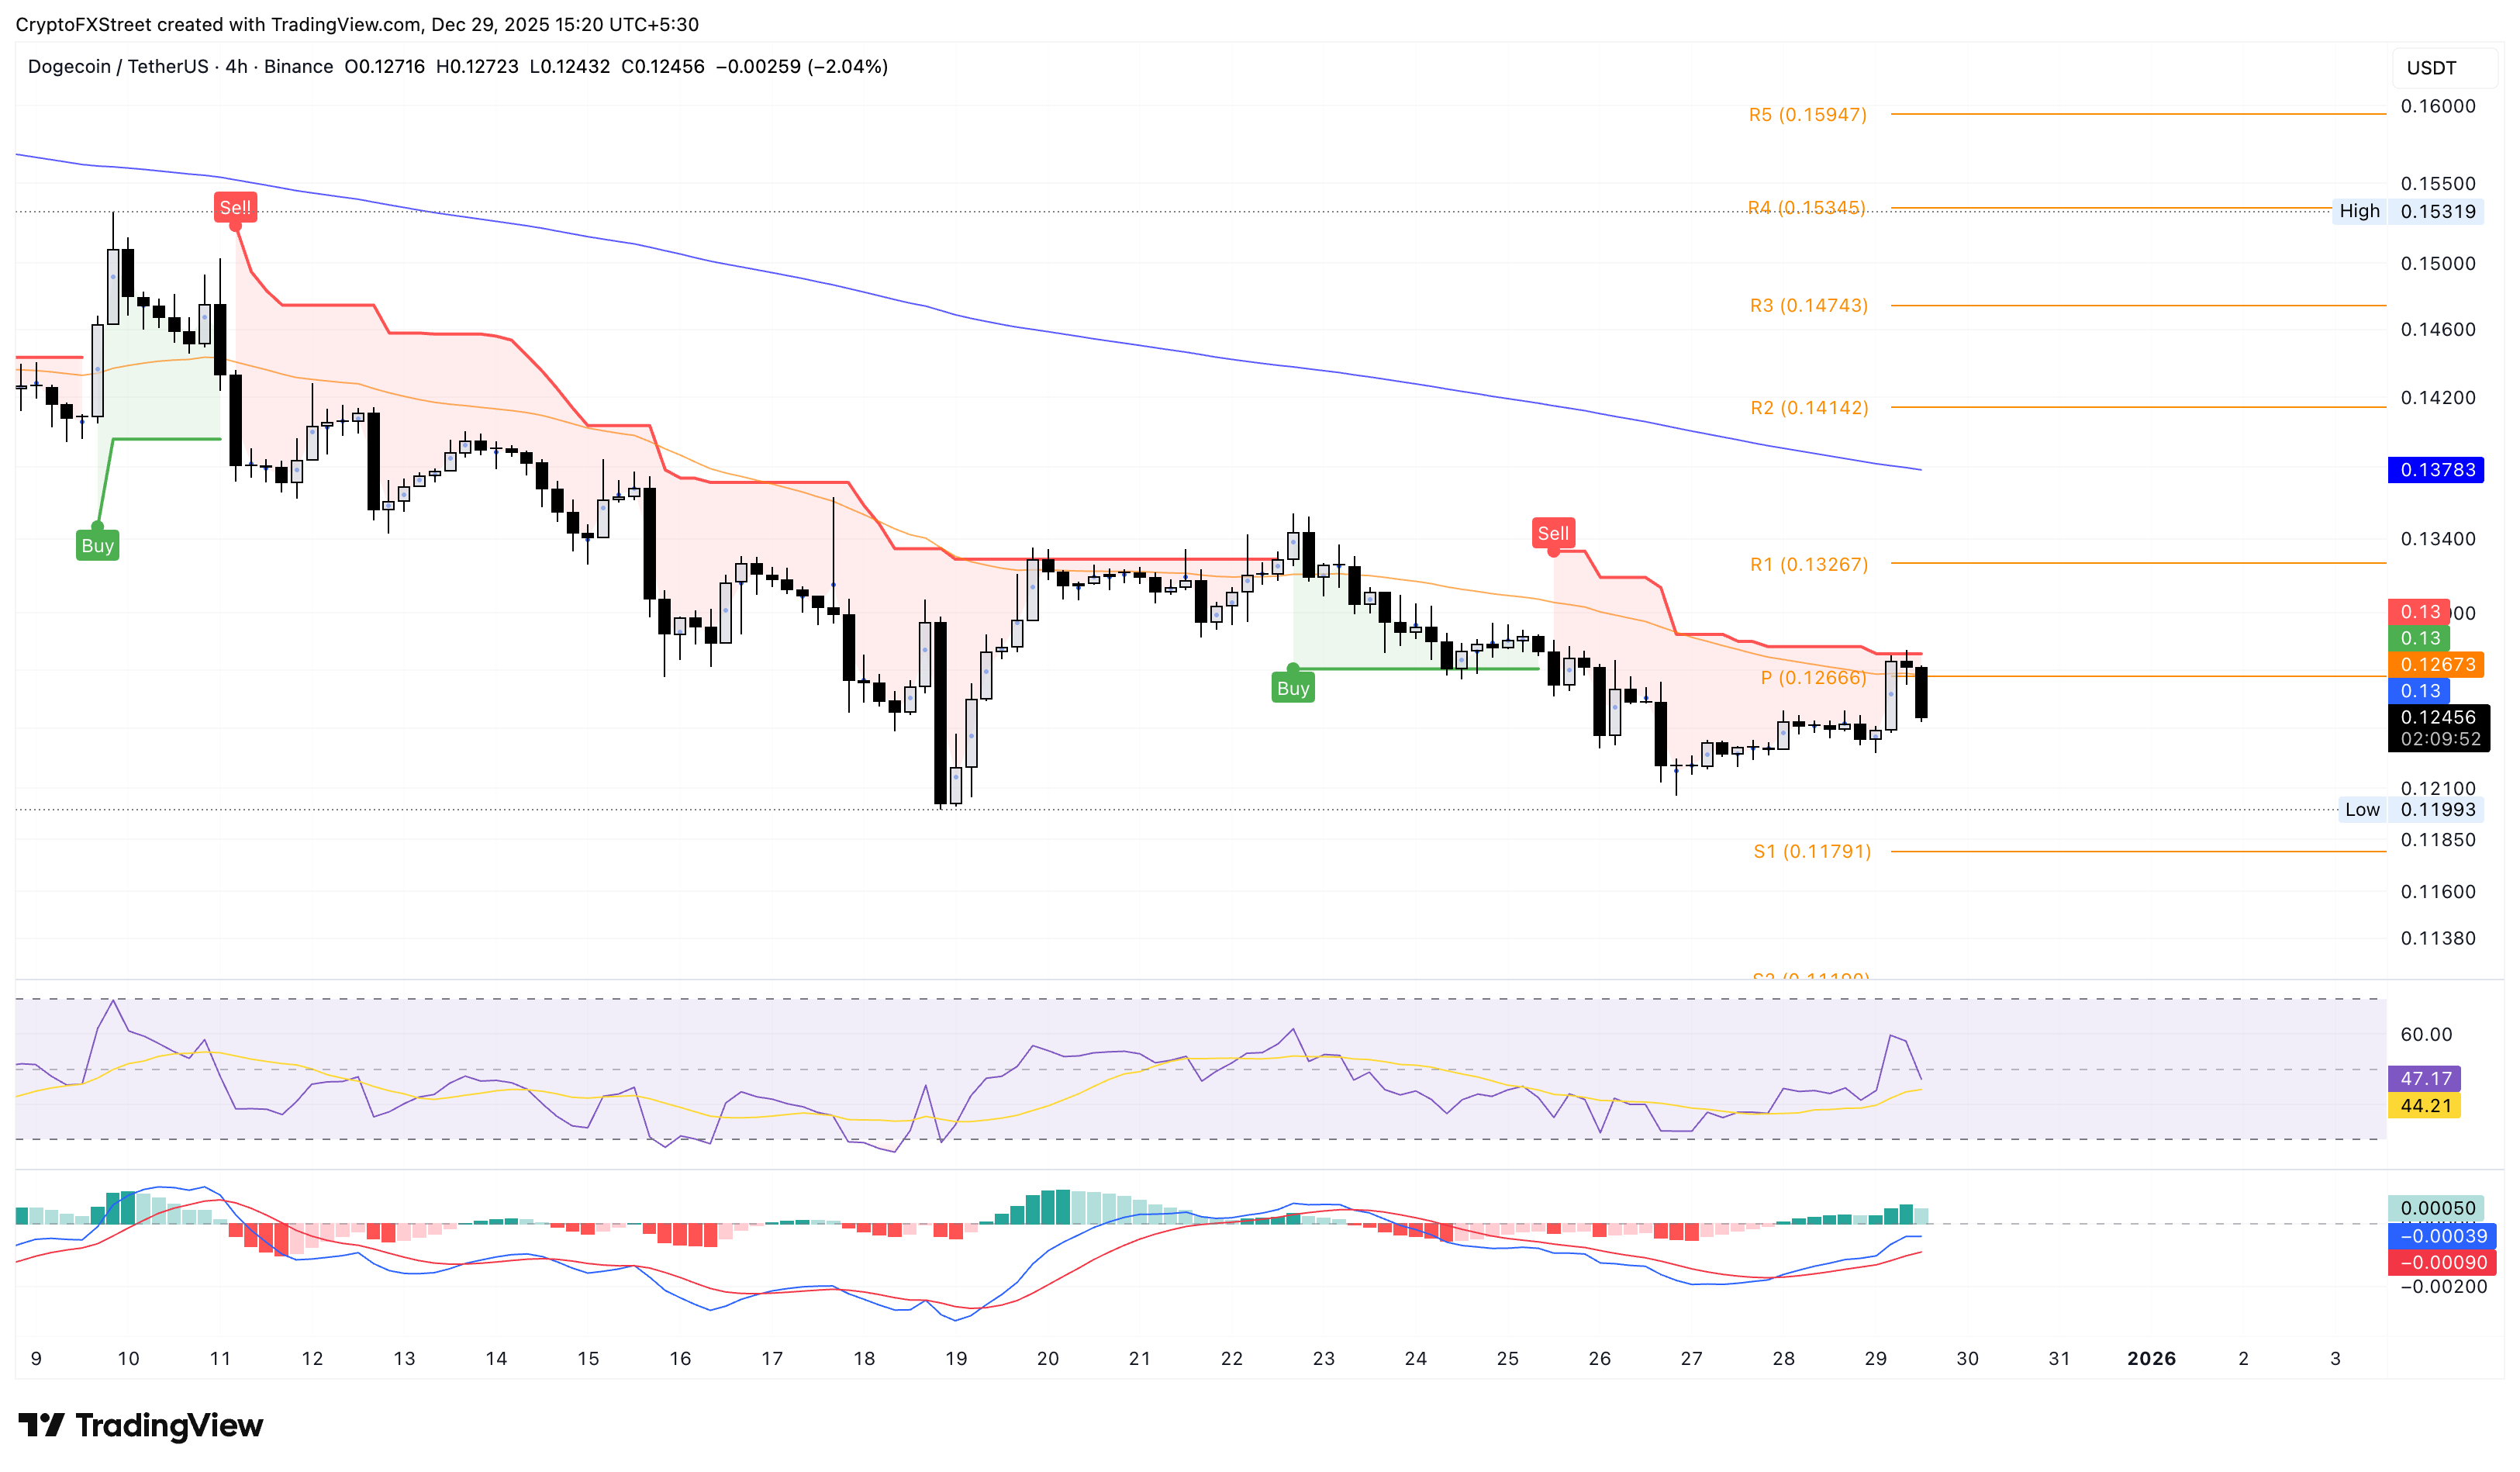
If DOGE reverses below $0.1266, it could retest the December 18 low of $0.1199.
Shiba Inu hits a crucial resistance
Shiba Inu trades below $0.00000750, reversing from the R1 Pivot Point at $0.00000757 on the 4-hour chart earlier on the day. At the time of writing, SHIB holds broadly steady, well above the Supertrend indicator, triggering a buy signal.
To further extend its recovery, the meme coin should exceed $0.00000757, which could target the R2 Pivot Point at $0.00000773, followed by the 200-period EMA at $0.00000794.
The technical indicators on the 4-hour chart suggest a steady rise in bullish pressure. The RSI is at 55, maintaining a broadly upward trend, while the MACD steadies above the zero line.
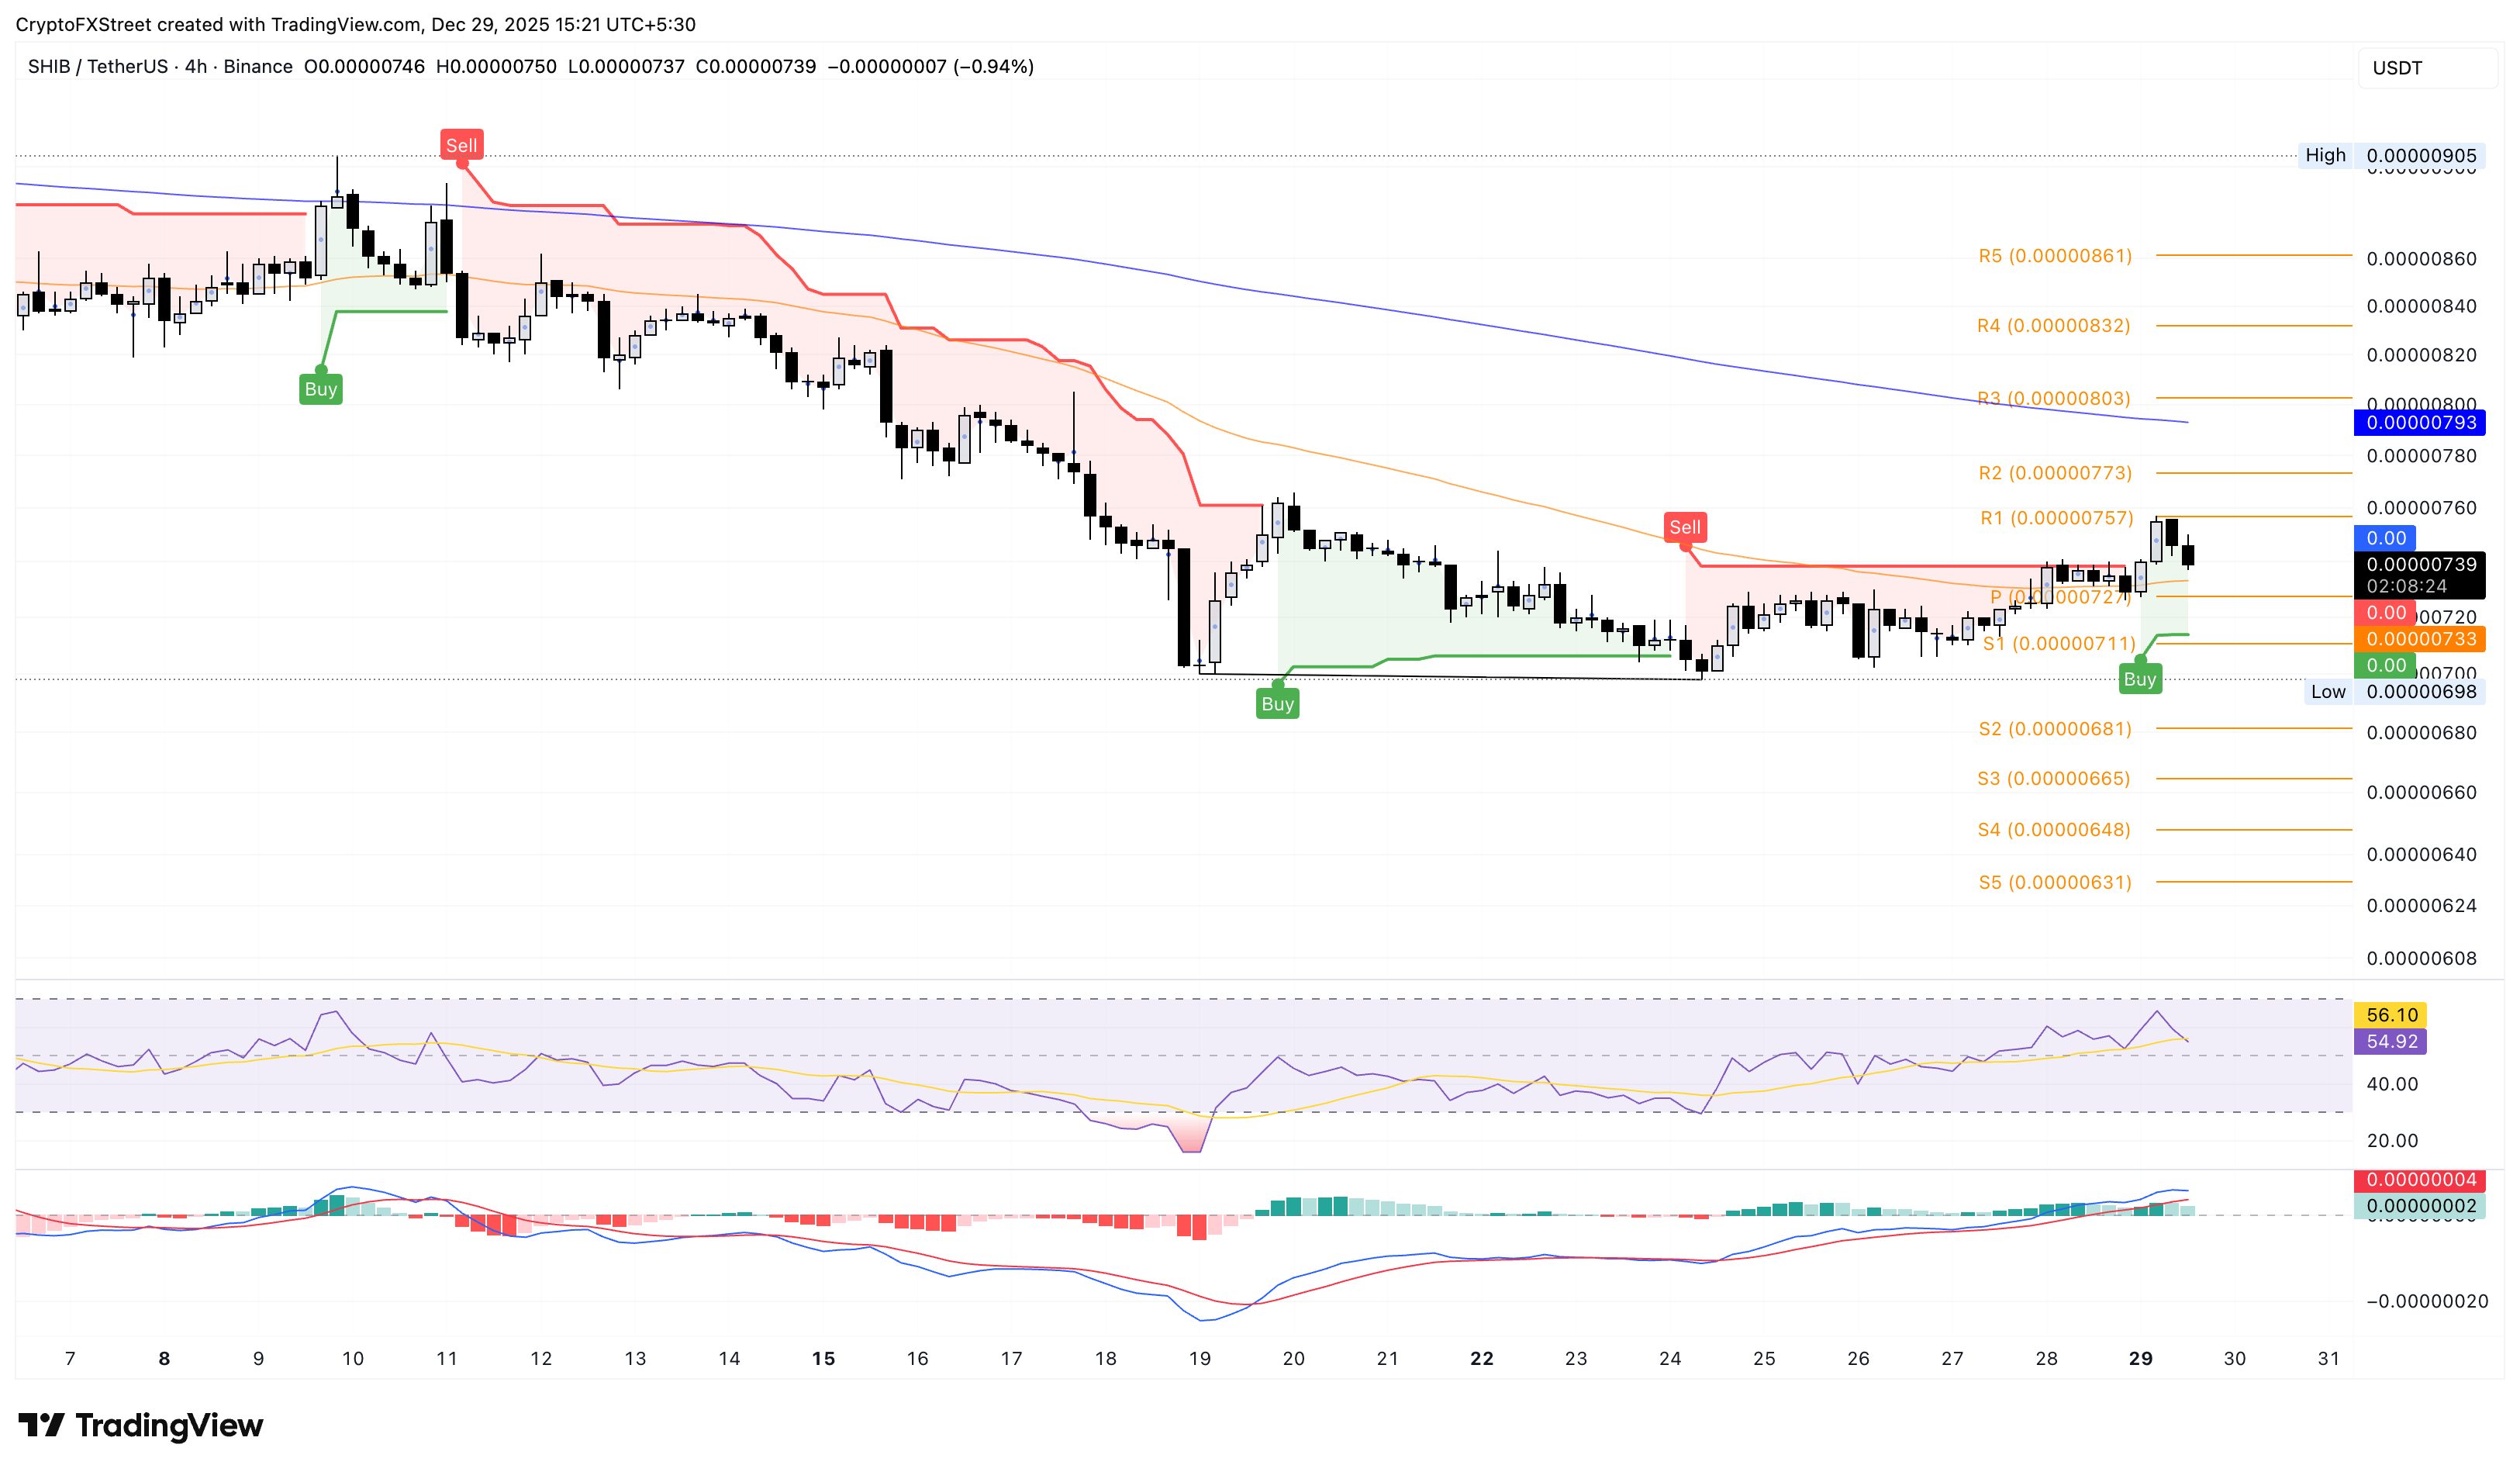
Looking down, a potential reversal in SHIB could find the 50-period EMA at $0.00000733 and the centre Pivot Point at $0.00000727 as support levels.
Pepe’s recovery halts, risking a potential downturn
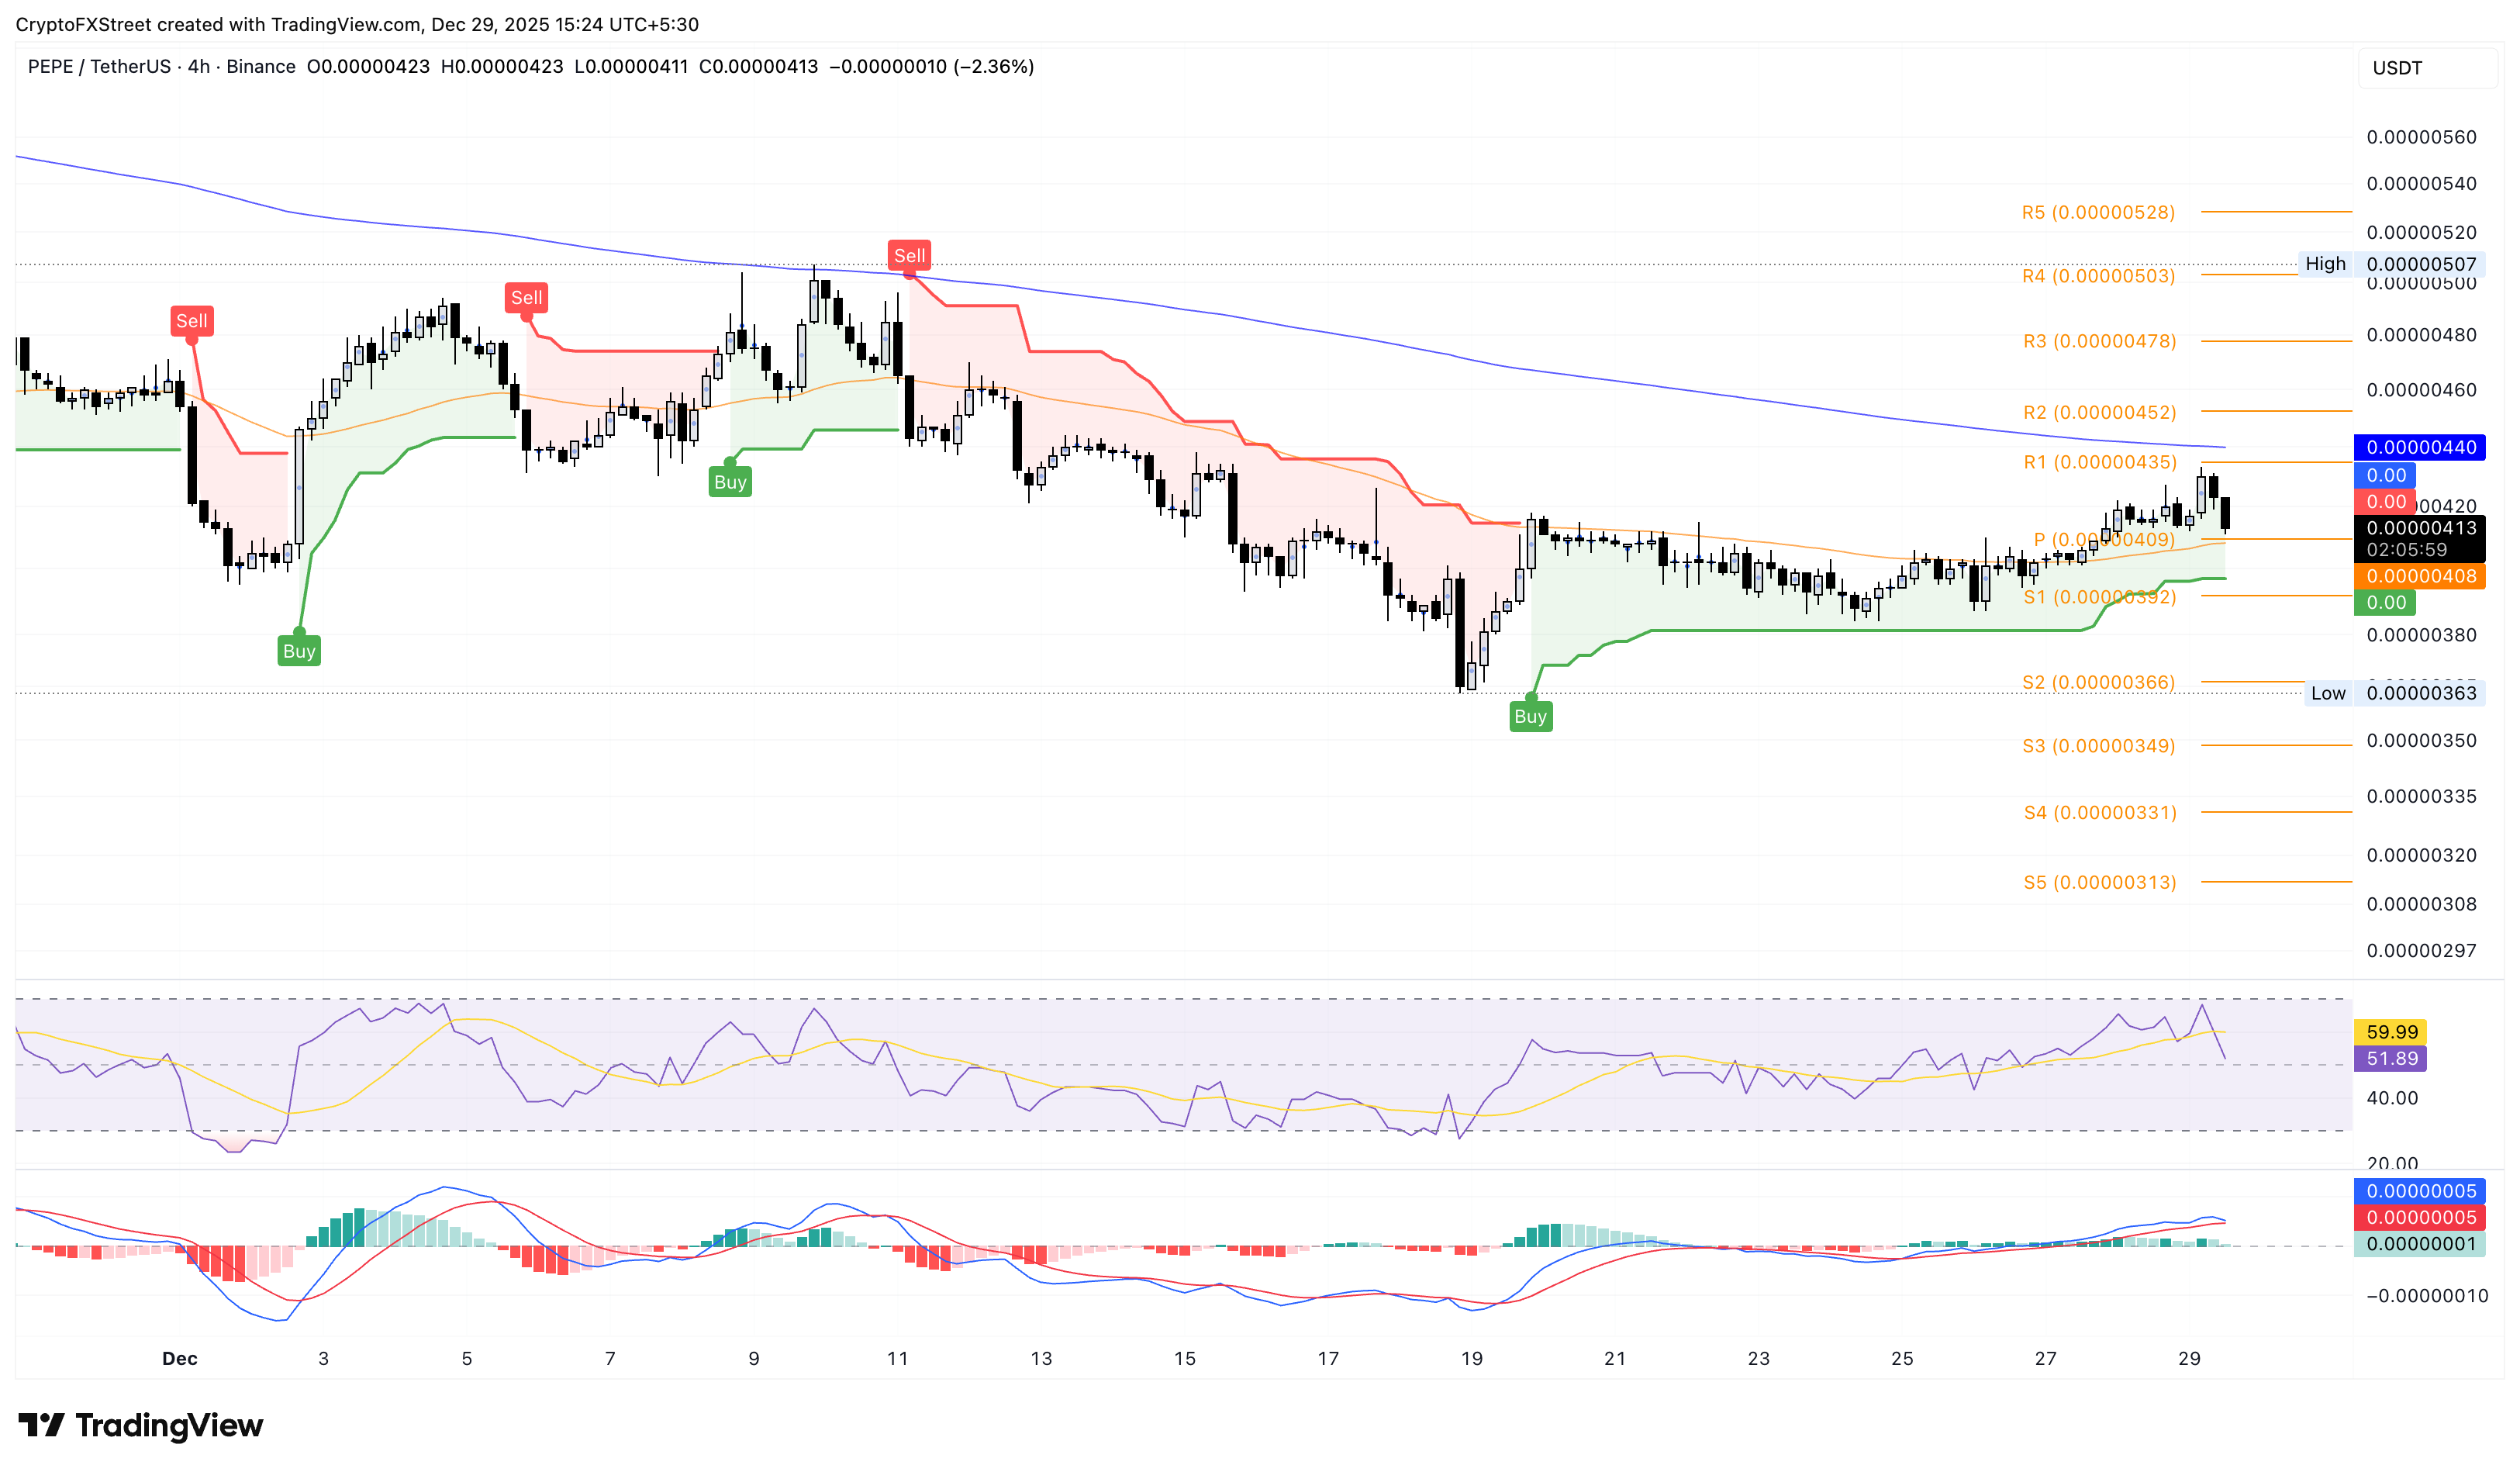
Pepe hovers above $0.00000400 at press time on Monday, maintaining a broadly recovering trend, according to the Supertrend indicator on the 4-hour chart. The frog-themed meme coin extends a reversal from near the R1 Pivot Point at $0.00000435, risking a retest of the centre Pivot Point at $0.00000409.
If PEPE slips below this level, it could test the S1 Pivot Point at $0.00000392 and flip the Supertrend indicator signal.
The RSI at 51 on the 4-hour chart shows multiple rejections from the overbought zone, indicating unsustainable buying pressure. Still, the MACD and signal line are at risk of a crossover, which could trigger renewed bearish pressure.
Author

Vishal Dixit
FXStreet
Vishal Dixit holds a B.Sc. in Chemistry from Wilson College but found his true calling in the world of crypto.




